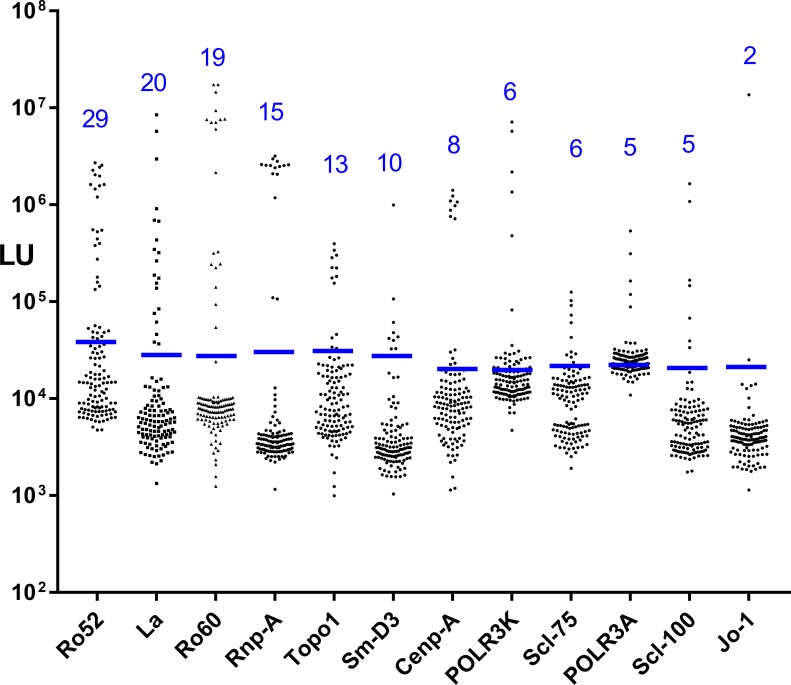
Fig 2. Serum autoantibody levels in the SSc/SRC and SSc/no SRC cohort.
Autoantibody measurements were made by LIPS against the 12 autoantigens in the 121 blinded serum samples corresponding to a total of 16 SRC and 30 SSc/no SRC cases. The Y axis reflects the antibody levels in LU determined by LIPS. The blue line is the cut-off value for each antigen. As shown by the numbers in blue, the most prevalent autoantibodies were against Ro52, while the least common were against the Jo-1 autoantigen.

