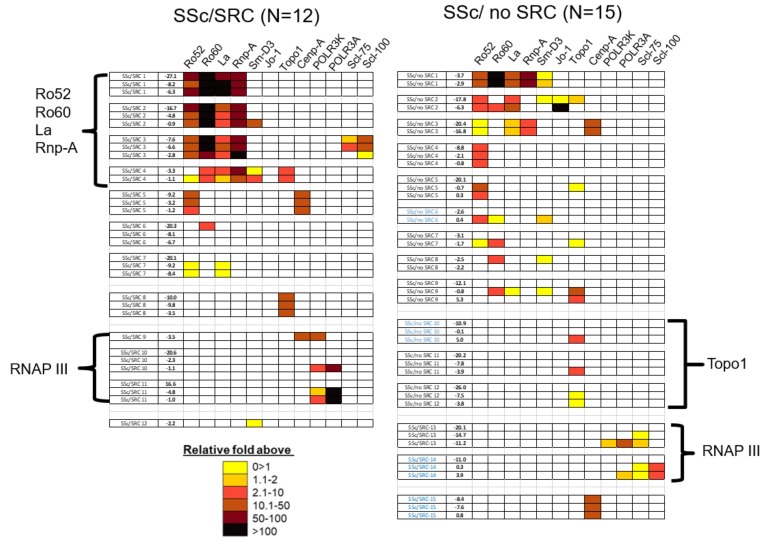
Fig 3. Heatmap analysis of autoantibodies in the SSc/SRC and SSc/no SRC cases.
Heatmap analysis of autoantibody responses are shown in the 12 seropositive SSc/SRC and 15 seropositive SSc/no SRC subjects. For each case, the time in years before (-) or after (+) initial systemic sclerosis diagnosis is denoted in the column on the left. Each group of rows represents the autoantibody profile in a single case, in which the blue colored codes represent SSc cases with autoantibodies detected after diagnosis. Color coding denotes relative antibody levels above the baseline cut-off value and the clear boxes represent seronegative responses with the autoantigens in a given subject. As shown by the key, seropositive autoantibody levels in the subjects ranged from low levels (yellow) to extremely high autoantibody levels (black). Based on the patterns that emerged, the SSc/no SRC and SSc/SRC subjects were then manually segregated into three autoantibody clusters for Ro6o/Ro52/La/Rnp-A, Topo1 and RNAP III.

