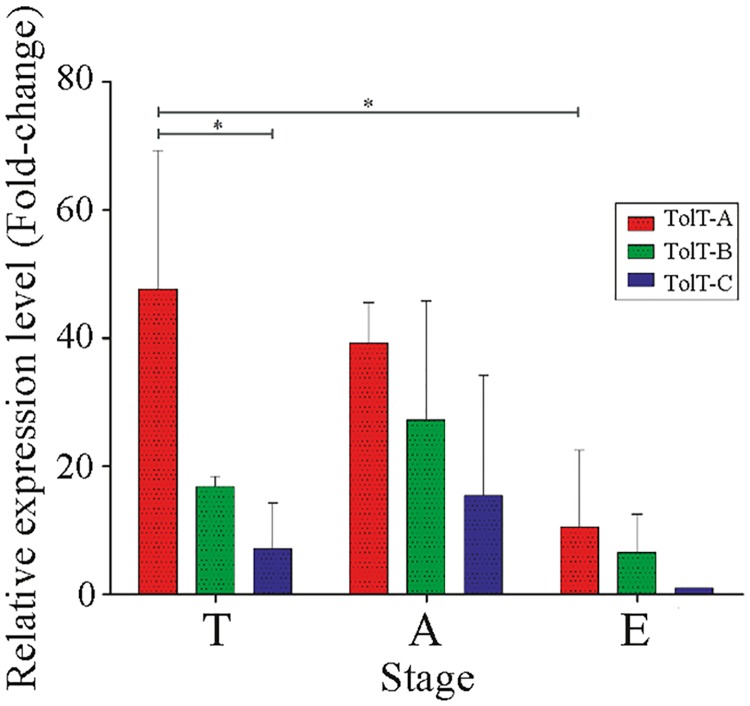
Fig 4. Expression analysis of TolT mRNAs in T. cruzi.
mRNA expression profile of different TolT groups on major developmental stages of T. cruzi CL Brener. Asterisks denote significant differences between the population means (P < 0.05) assessed by two-way ANOVA test after Bonferroni’s correction. A, amastigote; T, trypomastigote; E, epimastigote.

