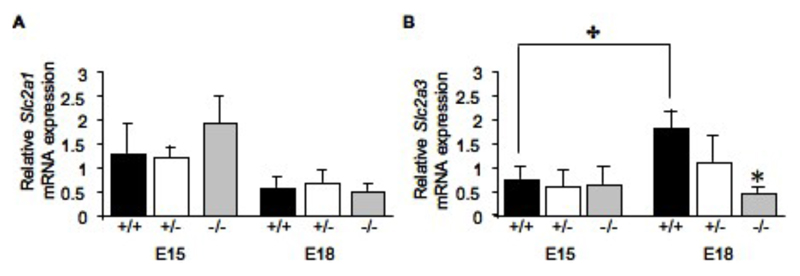
Figure 3.
Relative mRNA expression of the glucose transporters Slc2a1 (A) and Slc2a3 (B) in the labyrinth zone of placentas from 11ß-HSD2+/+, +/- and -/- fetuses at E15 and E18. Values are the mean + SEM. ✤ denotes an overall effect of gestational age (two-way ANOVA, P<0.05), * denotes differences from 11ß-HSD2+/+ within the time point (one-way ANOVA, P<0.05).

