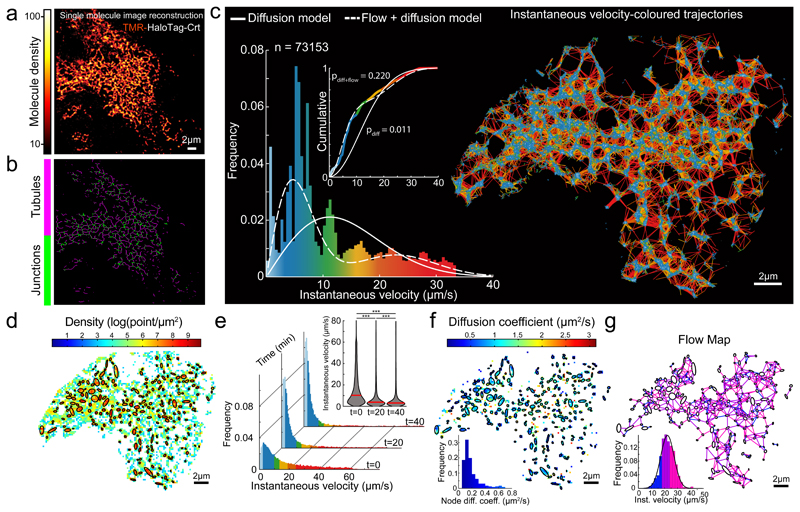
Fig. 2. Characteristics of single particle displacement tracked in the tubular ER lumen.
(a) Image reconstructed from single molecule localizations of TMR-labeled Halo-tagged Calreticulin (Crt), in HEK-293 cells, rendered with a molecular density colour code.
(b) Skeletonization view of image in (a). Shown are representatives of n=3 independent experiments.
(c) Single molecule trajectories generated using particle-tracking algorithm from time series of image (a)), color-coded according to instantaneous velocity distribution shown in histogram. Overlaid traces: velocity distribution simulated assuming exclusively diffusion-driven motion (solid line, using apparent D5 from (h)), or combination of diffusion and flow (using D and flow rate from f & g). Inset: cumulative distribution, Kolmogorov-Smirnov test of observed vs. expected distributions.
(d) Density map computed for grid of square bins (sides of 0.2 μm) imposed on particle displacement map. Ellipses mark boundaries of higher density regions (correspond to tube-connecting reservoirs/junctions).
(e) Histograms of instantaneous velocity frequency distributions of SPT from a cell before/after ATP depletion (as in Fig. 1 a-c). Inset: violin plot presenting the medians (red bars) and density (grey) of the distributions. A two-sided Mann-Whitney U-test was used to compare median of each pair of distributions (*** p-value < 1e-3), p(0-20 min)=1e-80, p(20-40 min)=9.889e-64, p(0-40 min)=1e-80; n=20526, n=14591 and n=10108 trajectory displacements respectively.
(f) Diffusion map extracted from the empirical estimator of the Langevin equation (1, Suppl. Note 1) and computed from a square grid as in d. Inset: distributions of the diffusion coefficients inside nodes (AVG +/- SD=0.19 +/- 0.13, n=226 nodes).
(g) Flow map computed by averaging non-Brownian velocity jumps of particles moving between pairs of neighbouring nodes identified in (d) and color-coded according to the inset histogram. Inset: distribution of average instantaneous velocity between pairs of neighbouring nodes (n=705 node-pairs; AVG +/- SD=22.90 +/- 6.92).
Raw source single molecule time series and image-reconstruction are shown in Supplementary Video 2.

