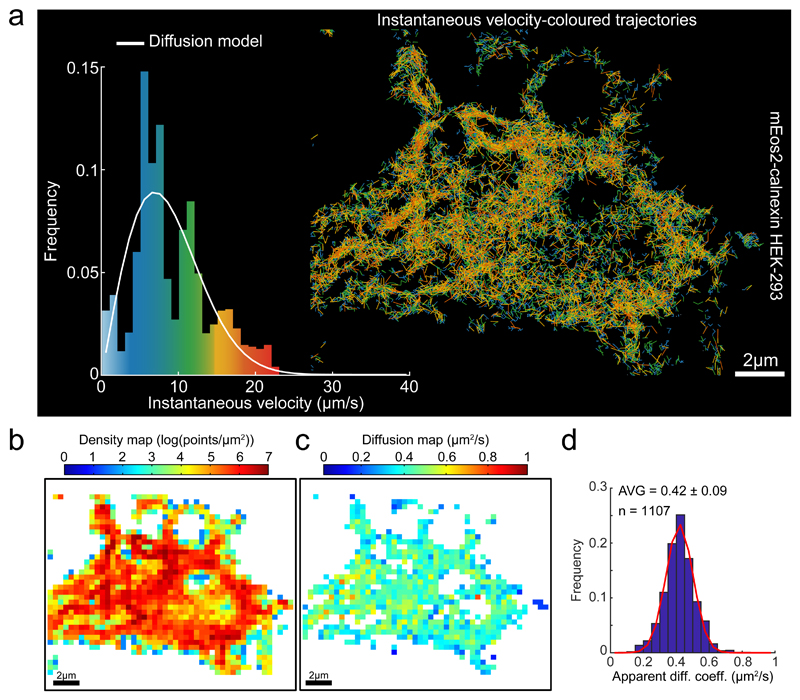
Fig. 3. Statistics of Single Particle trajectories recorded from the ER membrane.
(a) Single molecule trajectories of mEOS2-calnexin expressed in HEK-293 cells generated as in Figure 2, color-coded according to instantaneous velocity distribution Inset: Instantaneous velocity distribution histograms computed from the displacements extracted from the trajectories and overlaid by the expected distribution for a purely diffusive motion with the diffusion coefficient extracted from (d).
(b) Density map computed for a grid of square bins (sides of 0.4 μm) imposed on the particle displacement map.
(c) Diffusion map extracted from the empirical estimator of the Langevin equation (1, methods) and computed from the same square grid as in (b).
(d) Histograms of diffusion coefficients computed from individual square bins, pooled from two cells, for the entire domain as presented in (c). The red curve on top of the diffusion histogram corresponds to a fit (Trust Region Reflecting algorithm) to a Gaussian distribution with μD = 0.42 μm2/s, σD = 0.12 μm2/s and a determination coefficient R2 = 0.986. Descriptive statistics given as AVG +/- SD.

