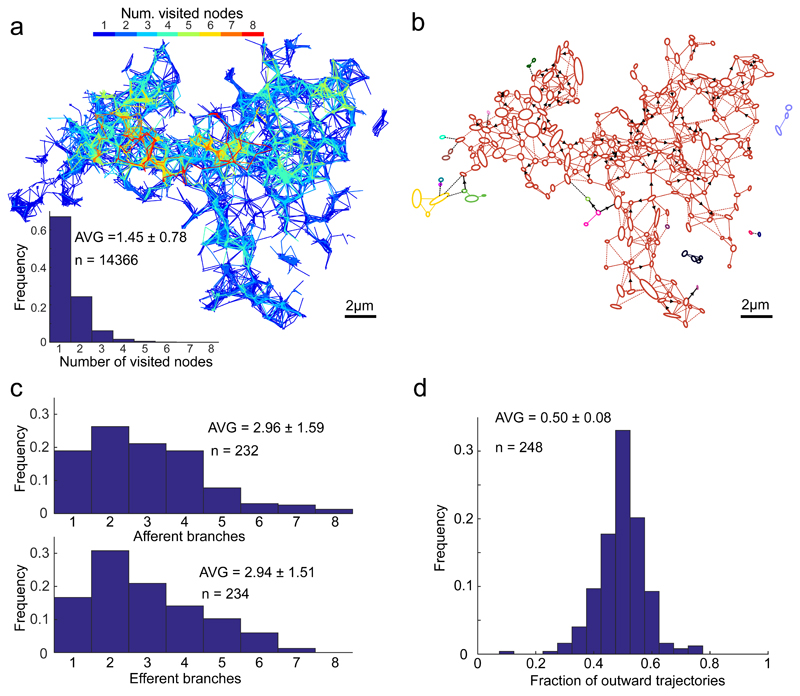
Fig. 4. Properties of ER luminal trajectories’ directionality.
(a) Number of nodes visited by individual particles. Trajectories map, as in Figure 2, colour-coded according to the number of nodes visited by a particle; and the distribution of the number of nodes visited by each individual trajectory (excluding trajectories visiting 0 node).
(b) Vectorial representation of the ER network from Figure 2 analysed using Oriented Network Graph analysis, to assess the direct or proxy, uni/bi-lateral trajectory-connectivity of the nodes, assigning single colour for each interconnected area. Note a strong connected component resulting in a monochromatic appearance of almost the entire network. Arrows denote prevalent displacement directionality (detected in 18% of tubes), defined as such if steady-state ratio of flow in one direction vs. the total flow exceed 0.75. Dashed links represent flows whose directionality could not be determined due to insufficient number of displacement events.
(c) Distribution histogram of the number of outward (efferent) and inward (afferent) directed branching for individual nodes. Efferent branches were defined as the number of nodes, reached by the outward trajectories originating in the examined node, in the time-integrated map; accordingly, afferent branches reflect the number of nodes-of-origin for the trajectories arriving at the examined node.
(d) Distribution of the fraction of exiting trajectories for each node.
All values are given as AVG ± SD.

