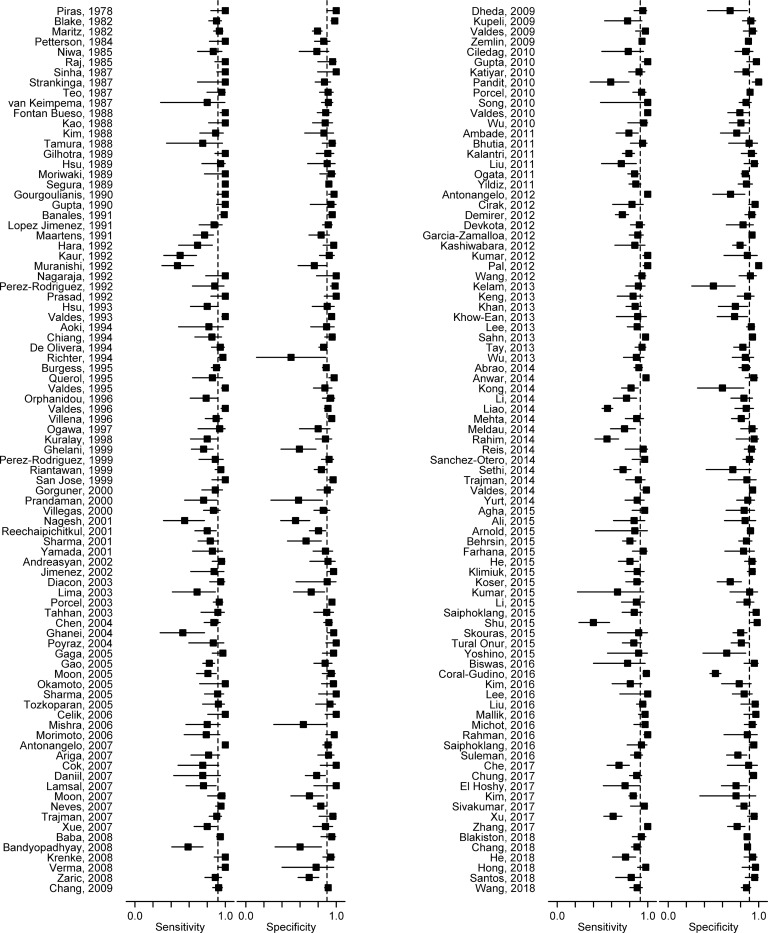
Fig 2. Forest plot of 174 studies on sensitivity and specificity of pleural fluid adenosine deaminase in diagnosing tuberculous pleural effusion.
Solid squares indicate individual study estimates, and horizontal lines represent corresponding 95% confidence limits. Vertical dashed lines correspond to summary estimates of sensitivity and specificity.

