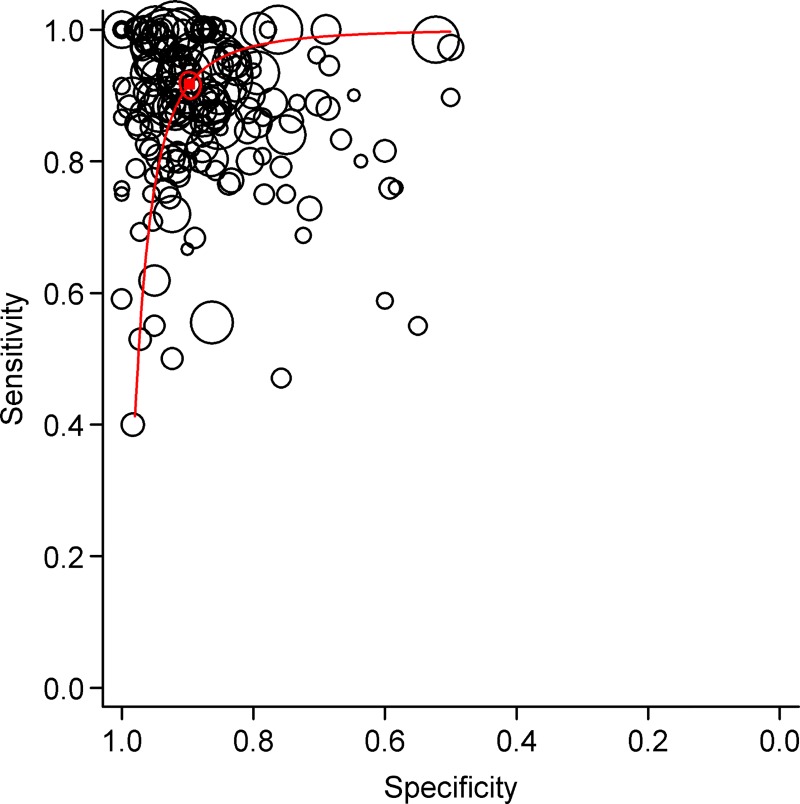
Fig 3. Hierarchical summary receiver operating characteristic (HSROC) curves summarizing diagnostic performance of pleural fluid adenosine deaminase for diagnosis of tuberculous pleural effusion.
Each individual study is represented by an open circle, whose size is proportional to the inverse standard error of sensitivity and specificity. The dark square represents the summary estimate of test accuracy, with the surrounding dashed zone outline denoting the 95% confidence region around this estimate.

