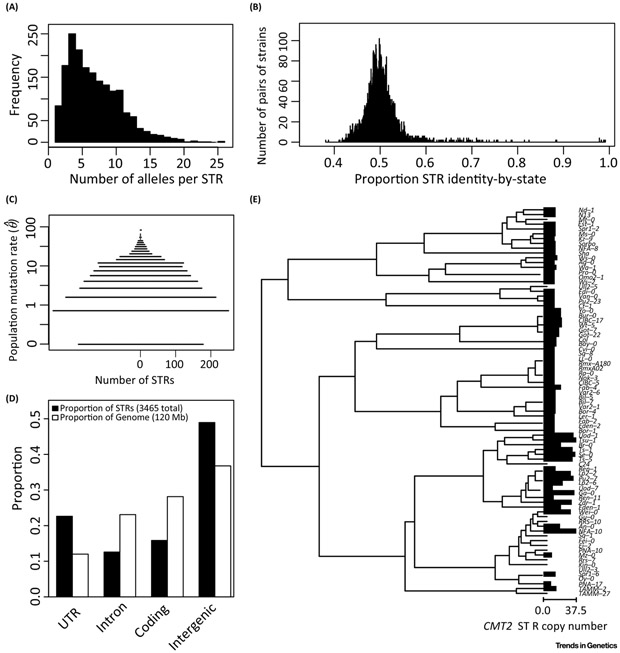
Figure 1. STRs demonstrate features of high mutation rate elements.
STR loci demonstrate (A) multiallelism, (B) low allelic similarity between strains, (C) high mutation rate, (D) context-dependent mutation rate variation, and (E) parallelism. Data and figures adapted from [13]. (A): Number of alleles at each STR locus. (B): All pairs of strains were compared at all positions where both strains had STR allele calls, and the number of alleles in common was computed. (C): Population mutation rate was computed according to [52]. Observed mutation rates of zero had a small nonzero value added such that they could be shown on the log scale. (D): Gross localization of STRs in the A. thaliana genome. Annotations from Araport11 were compared to STR calls from [13]; UTR: untranslated regions. (E) Parallel expansions and contractions of the CMT2 STR across A. thaliana strains, adapted from [13]; tree represents UPGMA clustering of strains according to full CMT2 gene sequence, according to the Kimura 2-parameter model (which considers only transitions and transversions). Bars represent the relative copy number of the CMT2 STR, bars are omitted in cases of missing data for a strain; observed values ranged from 8.5 to 37.5 repeat units.

