
Fig. 2.
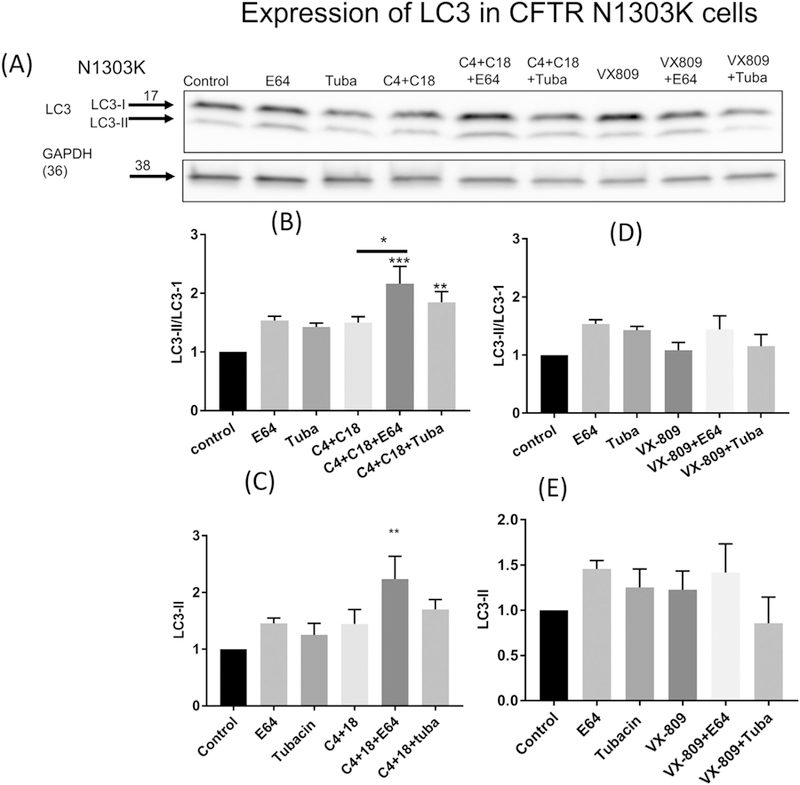
Autophagy and N1303K. (2A). Western blot of LC3 I&II measured in CFBE41o− cells stably expressing N1303K. Note that treatment with E64, tubacin or the combination of correctors C4 + C18 has little effect on the ratio of LC3II/I (2B) or absolute amount of LC3-II (lanes 1–4) (2C). In contrast, following treatment with the combination of correctors and E64 (lane 5) there is a significant increase in the LC3II/I ratio and absolute amount of LC3II and (2B–C). Tubacin treatment has a small effect in combination with C4 + C18 (Lane 6) (4B–C). In contrast VX-809 does not influence LC3II or the ratio either alone or in combination with E64 or tubacin (lanes 7–9) (2D–C). Data are normalized to the absence of treatment. Data are expressed as the mean ± SEM of 3 independent experiments. Methods as described for Fig. 1.