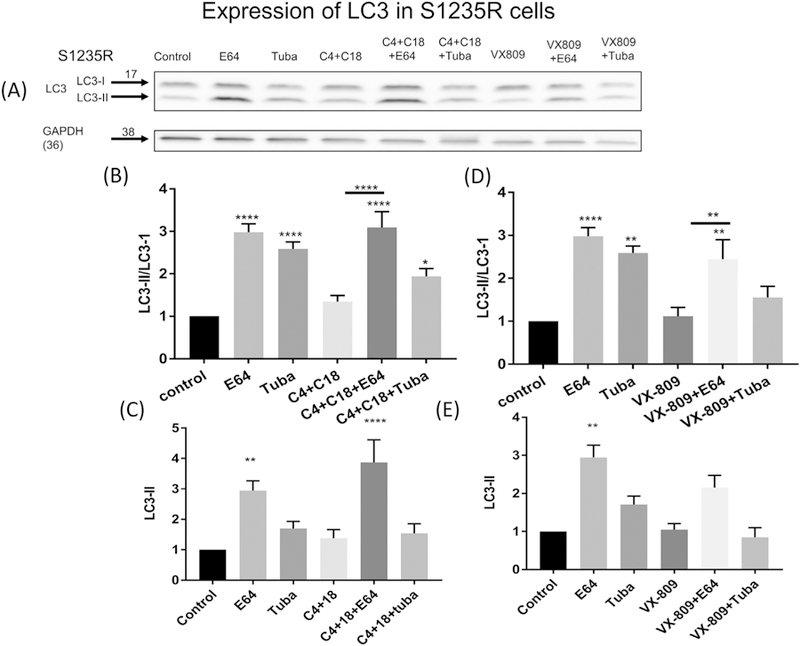
Fig. 4.

Autophagy and S1235R. (4A). Western blot of LC3 I&II measured in CFBE41o− cells stably expressing S1235R (Lane 1). Note that treatment with E64 (Lane 2), or tubacin (Lane 3) has an effect on the ratio of LC3II/I (4B & D) and on the absolute amount of LC3-II (4C & E) which is significant only for the E64 treatment. Treatment with the combination of C4 + C18 (Lane 4) had no significant effect either on the LC3II/I ratio (4B) or the absolute amount of LC3II (4C). In contrast, following treatment with the combination of correctors and E64 (lane 5) there is a significant increase in LC3II and the LC3II/I ratio (4B–D). Tubacin treatment has a small effect in combination with C4 + C18 (Lane 6). VX-809 has a similar albeit smaller effect compared to the combination of correctors (lane 6–8) (4C–D). Data are normalized to the absence of treatment Data are expressed as the mean ± SEM of 3 independent experiments. Methods as described for Fig. 1.
