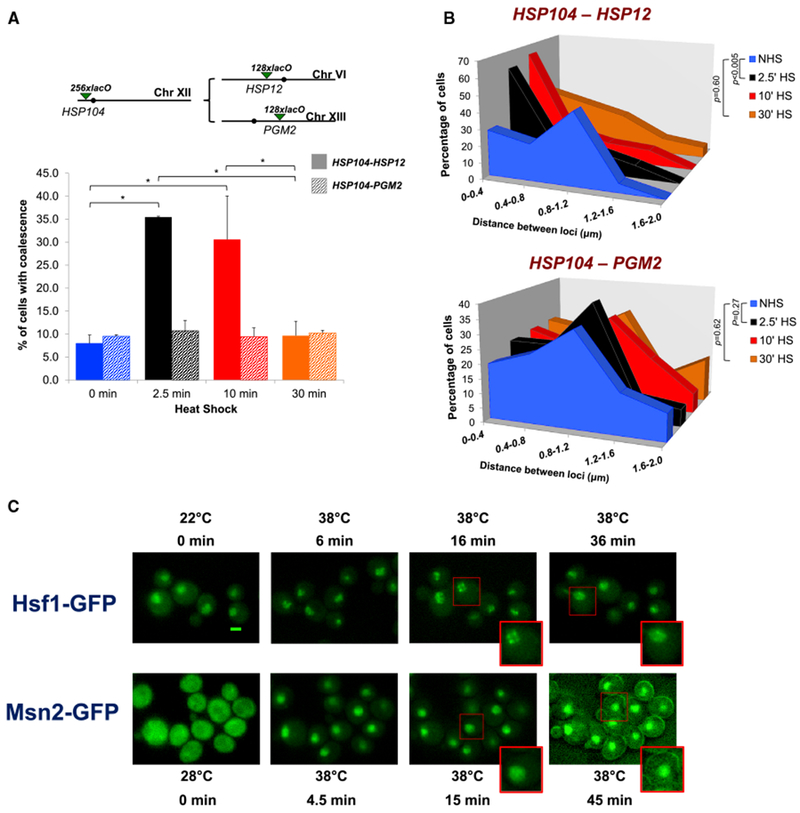
Figure 3. Single-Cell Analysis Reveals Preferential, Dynamic Coalescence between Hsf1-Target Genes Paralleled by Hsf1 Puncta Formation.

(A) Top: schematic of lacO-tagged loci present in HSP104/HSP12 or HSP104/PGM2 heterozygous diploids (filled circles, centromeres). Bottom: the percentage of cells bearing tagged HSP104-HSP12 (solid bars) or HSP104-PGM2 (shaded bars) exhibiting coalescence as determined by fixed-cell fluorescence microscopy. For HSP104-HSP12, 50–70 cells were evaluated per sample at each time point (n = 2); for HSP104-PMA2, 50–100 cells were evaluated (n = 2). *p < 0.05 (calculated by one-way ANOVA followed by Tukey’s post hoc analysis). Data for HSP104-HSP12 coalescence are from Chowdhary et al.,2017 and are used with permission.
(B) Distribution of distances between HSP104 and HSP12 (top) or HSP104 and PGM2 (bottom) in cells subjected to the indicated conditions. Depicted is the percentage of cells with tagged loci within the indicated distance (binned at intervals of 0.4 μm) in a given population of fixed cells. This analysis encompasses only those cells in which two spots lie in the same plane and thus represents a subset of cells analyzed in (A). The distance across multiple planes could not be accurately measured due to the lower resolution in the Z direction. p values were calculated by Wilcoxon rank sum test.
(C) Fluorescence microscopy of live cells expressing Hsf1-GFP (top) or Msn2-GFP (bottom) before or following the application of heat for the times and temperatures indicated. Images are presented at the same magnification; cells boxed in red are enlarged at the bottom of the respective images. Scale bar, 2 μm.
See also Figures S2 and S3.
