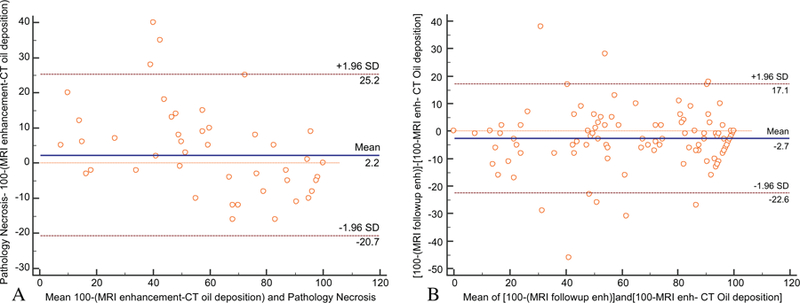
Fig. 6.

Bland-Altman plots for the two measurements for tumour necrosis with the representation of the 95 % limits of agreement (dashed brown lines), in the whole cohort (A) and in transplanted patients (B). The blue line shows the mean of difference between two measurements
