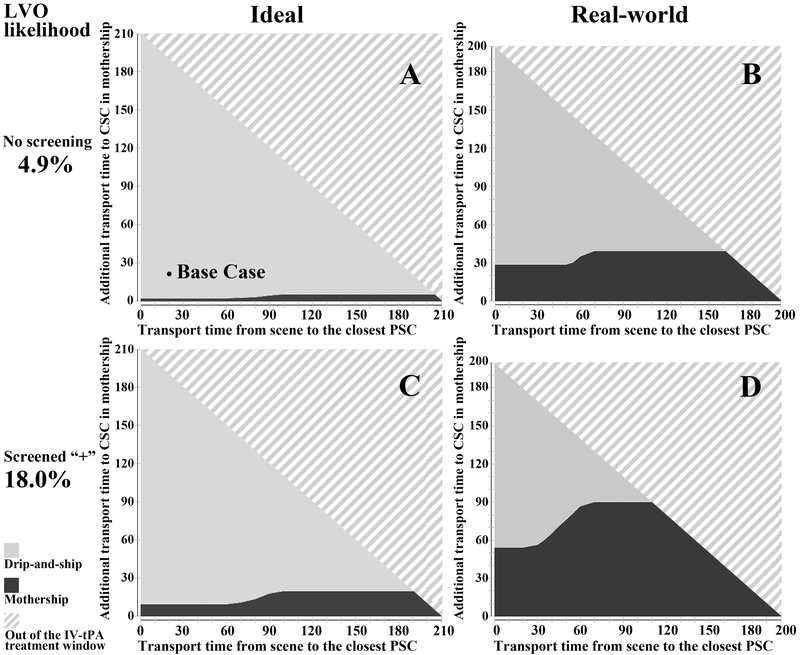
Figure 2. Selected results of three-way sensitivity analyses under ideal and real-world time metrics.
Three-way sensitivity analysis was conducted by jointly varying transport time from scene to primary stroke center, additional transport time if taken directly to a comprehensive stroke center, and the probability of a large vessel occlusion (LVO). (A) and (B) represent ideal and real-world time metrics, respectively, in the absence of formal LVO screening; (C) and (D) represent ideal and real-world scenarios, respectively, for patients screening positive with an LVO screening scale of moderate sensitivity and specificity (post-test probability of 18%). The solid dot in (A) represents the base case result; dark gray shading represents favorability of the direct-to-mothership approach, light gray shading represents favorability of the drip-and-ship approach, and the angled line pattern represents patients outside of the IV-tPA treatment window who were not included in this model. LVO, large vessel occlusion; PSC, primary stroke center; CSC, comprehensive stroke center.

