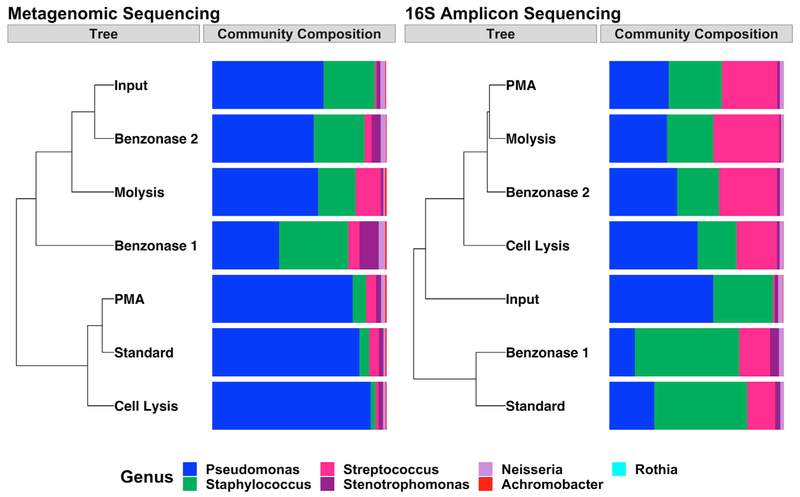
Figure 5. Effect of Extraction Method on Sequencing-Based Taxonomic Profile of a Bacterial Mock Community.
Data represent a single mock community extracted in parallel with each extraction method. Phylogenetic tree constructed using Bray-Curtis dissimilarity (“Tree”) and the corresponding phylogenetic composition (“Community Composition”) determined via (left) metagenomic sequencing and (right) 16S amplicon sequencing. Input refers to the relative abundance of the mock community before extraction based on quantitative culture. Viable counts were corrected for 16S copy number in the analysis of 16S amplicon sequence data.
See also Figure S5.

