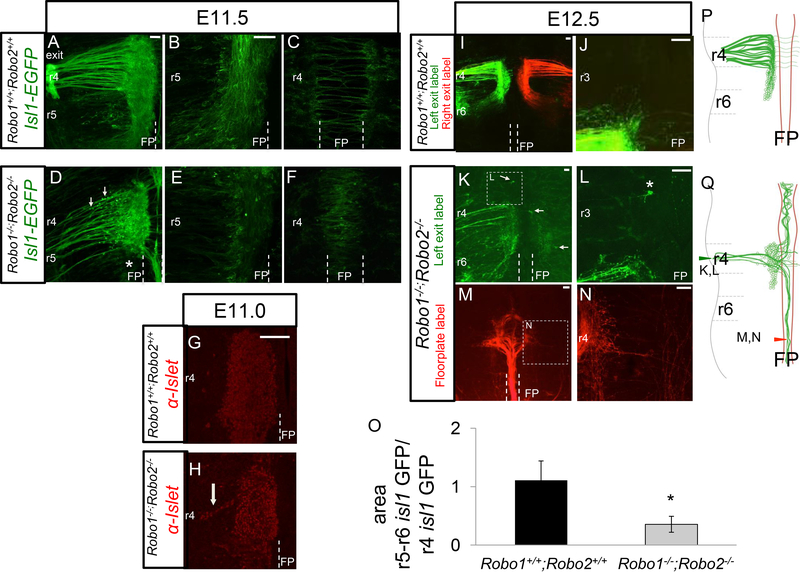
Figure 4. Robo1 and Robo2 regulate facial branchiomotor cell body position.
Control (A-C, G, H, K, L) and Robo1−/−;Robo2−/− (D-F, I, J, M-P) E11.5 and E12.5 open-book hindbrains expressing IslMN:GFP or labeled with NeuroVue tracers (M-P). A. On E11.5, facial axons added to fascicles already projecting to the motor exit point in control embryos. B. FBMN cell bodies migrate tangentially from ventral r4 towards r6. The majority of cell bodies were in r5, however some cell bodies had already made it to r6 by E11.5. C. Commissural axons of the IEE were the only axons seen crossing the floor plate in control embryos. D. In mutant E11.5 animals, FBMN cell bodies were ectopically positioned more dorsally in r4 (arrows), apparently migrating dorsally toward the exit point. In Robo1−/−;Robo2−/− embryos, axons added to the existing pioneer axons projecting to the exit point or floor plate. The fascicles coursing through the floor plate had increased in size relative to E10.5 embryos, suggesting that some newly projecting axons did not find the r4 exit point and instead followed axons into the floor plate. Few cell bodies could be seen in the caudal migration stream (*). E. There were significantly less cell bodies migrating caudally in mutant embryos, with the majority still residing in r4 (quantified in O). F. On E11.5, cell bodies were ectopically located in the floor plate. G-H. Islet1/2 antibody labels (red) of E11.0 open book whole mounts to show motor neuron cell body positions. High magnification views showing in controls that neuron cell bodies remained confined to the ventral position of the nucleus in r4 (G), while streams of neuron cell bodies migrating dorsally from the r4 nucleus (H, arrow), supporting the observation of dorsally migrating cell bodies seen by Isl1-GFP in D. I, J. Retrograde tracing in E12.5 control using the lipophilic NeuroVue tracers from the exit point, showing symmetrical labeling in green from the left exit, and red from the right exit. J. High magnification view of r3, showing the lack of any labeled neurons anterior to r4. K, L. Retrograde labels in E12.5 Robo1/2 mutant from the left exit point, with many fewer axons and cell bodies labeled. Neurons in ectopic positions can be seen in the floor plate and on the contralateral side (arrows), and also anterior to r3 (*, high mag in L). M, N. Retrograde tracing from a label site within the floor plate in r8, labeling a robust bundle of axons projecting longitudinally within the floor plate, and originating from cell bodies in r4. N. A few fibers (arrow) project dorsally toward the exit point, consistent with neurons with bifurcating axons that project both into the floor plate and toward the exit point. O. Quantification of the migration of Isl1-GFP neurons, as in the examples shown in A and D. The graph shows the ratio of Isl1-GFP labeled areas in r5–6 (migrating cells plus axons) compared to the Isl1-GFP area in r4 (stationary cells plus axons). Significantly less migration occurs in Robo1/2 mutants. Error bars show S.E.M. *p<0.05 n=5 control, n=3 Robo1−/−;Robo2-/−. Scale bar 50 μm.

