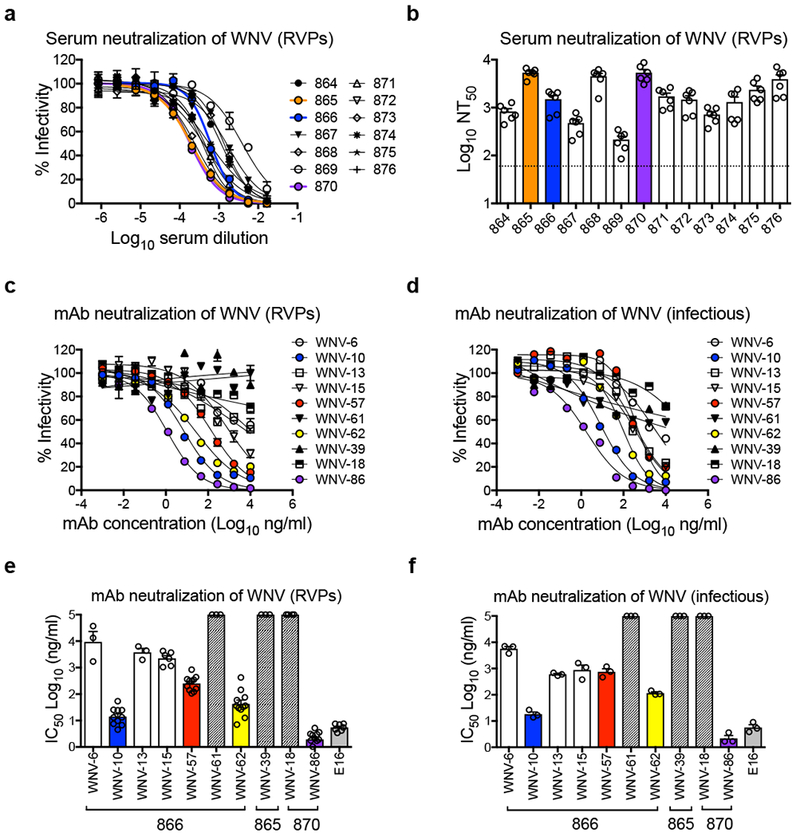
Figure 1. Serum and mAb neutralization of WNV.

(a) Dose-response neutralization curves of WNV RVPs against 13 WNV convalescent human serum samples representative of five independent experiments with similar results. Infectivity levels were normalized to those observed in the absence of antibody. Data points and error bars indicate the mean and range of duplicate infections, respectively. Reciprocal neutralization titers were obtained by non-linear regression analysis constrained at the bottom to no infection (zero). (b) Mean values of the reciprocal serum dilution required to inhibit infection by 50% (NT50) obtained from five experiments, as indicated by open circles. Error bars represent the standard error of the mean (SEM). The dotted horizontal line shows the lowest serum dilution tested. Dose-response neutralization curves of (c) WNV RVPs or (d) fully infectious WNV against mAbs isolated from donors 866, 865, and 870 are representative of at least three independent experiments (see panels e and f) with similar results. Data points and error bars indicate the mean and range of duplicate infections, respectively. Mean values of mAb concentration required to inhibit infectivity by 50% (IC50) for (e) WNV RVPs or (f) fully infectious WNV were calculated from 3 independent experiments for all mAbs except WNV-10, WNV-57, WNV-62, WNV-86, E16 in panel e (8 independent experiments), as indicated by open circles. Error bars represent SEM. Hashed bars indicate that neutralization was not observed at the highest mAb concentration tested (10 μg/mL). The donor from which mAbs were isolated is indicated below the x-axis in panels e and f. Murine mAb E16 was included as a control in panels e and f.
