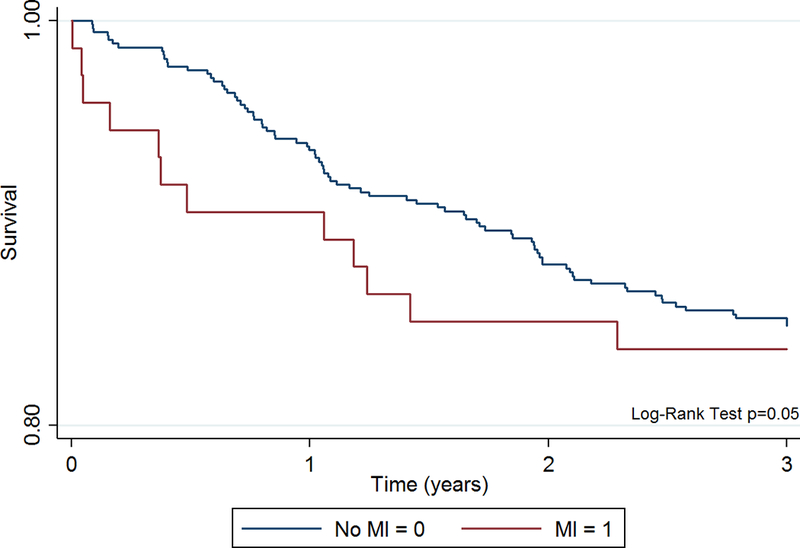
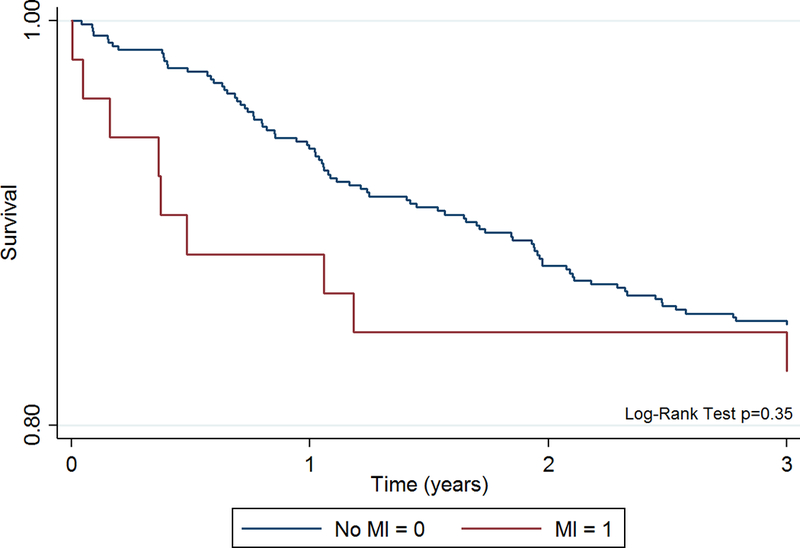
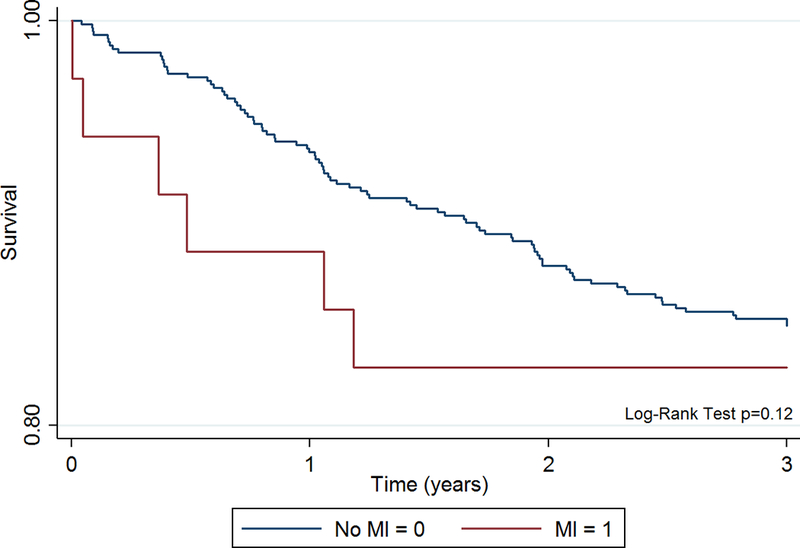
Figure 2A-C. Unadjusted Kaplan-Meier Survival Curves for MI diagnosed by three representative hscTnT metrics.


All MIs needed evidence if ischemic ECG changes plus either one postoperative hscTnT value >99th% (Fig. 2A), a >50% hscTnT increase (Fig. 2B), or a >5ng/L hscTnT increase (Fig. 2C).
