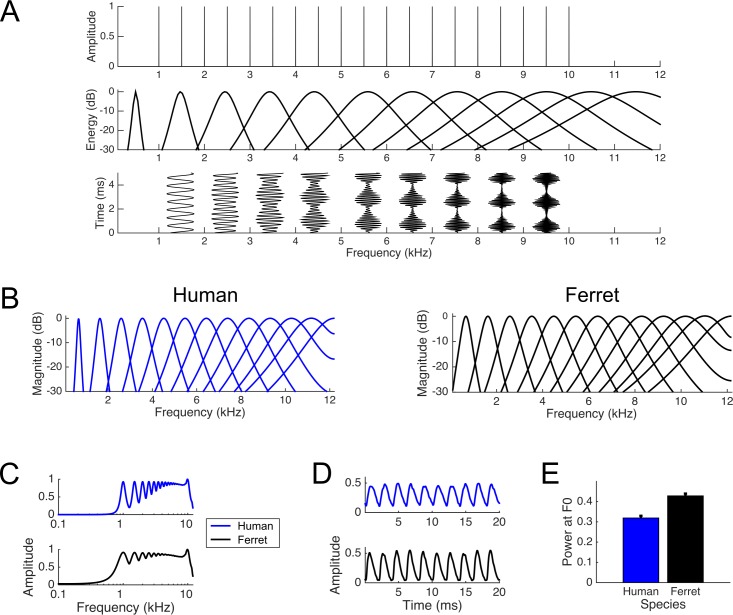
Figure 1. Simulated cochlear filters and their responses to a 500 Hz harmonic complex tone filtered from 1 to 10 kHz.
(A) Illustration of the role of unresolved and resolved harmonics in periodicity encoding. Upper plot: Amplitude spectrum for the tone complex contains all harmonics from 1 to 10 kHz. This sound will evoke a pitch corresponding to 500 Hz. Middle plot: Cartoon of the cochlear filters centred on every second harmonic of 500 Hz, based on data from Glasberg and Moore (1990). This illustrates that lower harmonics are resolved, while the cochlear filters corresponding to higher order harmonics respond to multiple harmonic components in the tone. Lower plot: The output of each of these cochlear filters is plotted throughout 5 ms of the tone complex. The resolved harmonics phase lock to the frequency of one harmonic, while unresolved harmonics beat at the sum of multiple harmonic components (i.e. 500 Hz), providing an explicit temporal representation of F0. B-E describe a computational model of the cochlear filter bank used to simulate representations of complex sounds in the ferret and human auditory nerve. Data are colour-coded for the human (blue) and ferret (black). (B) The frequency tuning of 15 example auditory nerve fibres is shown for the simulated human (left) and ferret (right) cochlea. C-E show analyses of the responses of human and ferret cochlear filter banks to the 500 Hz tone complex. (C) The response strengths of each of 500 auditory nerve fibres to the filtered tone complex were averaged across the duration of the sound, and plotted across the full range of centre frequencies. Many harmonics produce clearly resolvable activation peaks across fibres in the human cochlea (upper blue plot), but fewer harmonics are resolved in the ferret cochlea (lower black plot). (D) The temporal profile of the output of one simulated auditory nerve fibre with a centre frequency of 5 kHz is shown for the human (upper blue plot) and ferret (lower black plot) cochlea. (E) The power at 500 Hz in the output of each frequency filter, averaged across the full duration of the tone complex, is shown for the human (blue) and ferret (black) auditory nerve. For each species, these values were normalized by the maximal F0 power across all channels. The plot shows the mean (+standard error) normalized power at F0 across all auditory nerve fibres.

