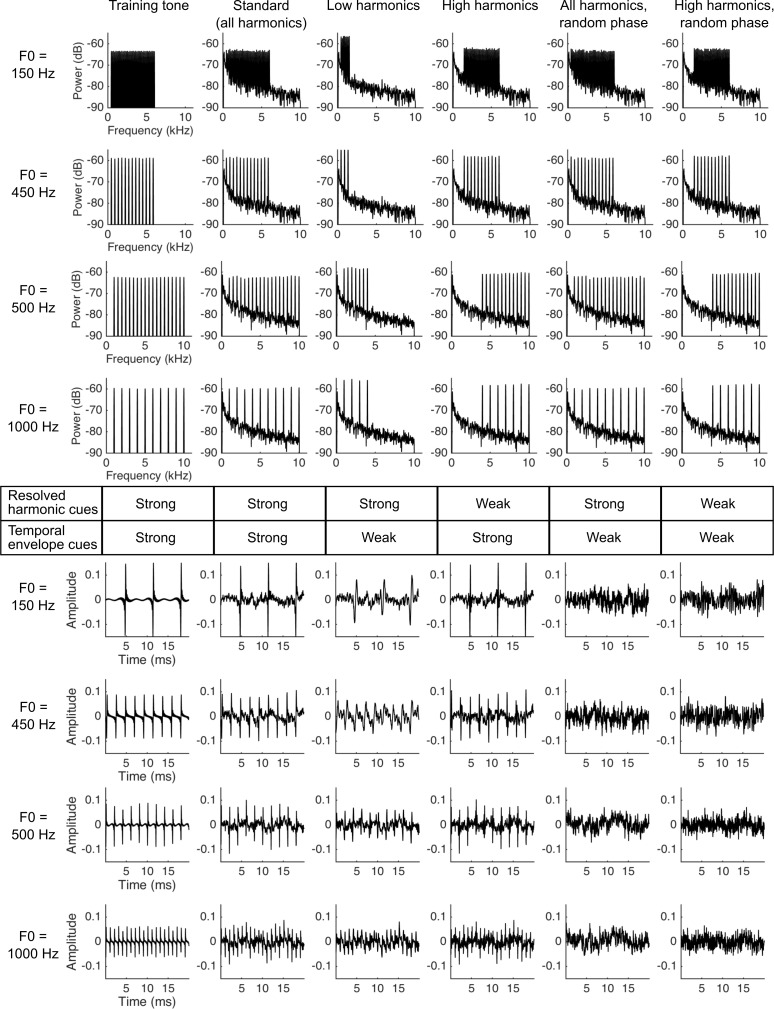
Figure 3. Stimuli used in the ferret pitch classification task.
Plots show the training tone (left column), standard stimulus (second column) and four probe stimuli (columns 3–6) used in the psychophysical task. There were two F0 ranges, with target stimuli with F0s of either 150 and 450 Hz, or 500 and 1000 Hz, indicated to the left of each row of plots. The top four rows show the power spectra of each target sound, while the bottom four rows plot a 20 ms excerpt of the corresponding sound waveform. The table in the middle of the figure indicates whether resolved harmonics (row 1) or temporal envelope (row 2) F0 cues are strong or weak in each stimulus. A pure tone reference sound was used in all experimental stages.

