. 2019 Mar 12;8:e41627. doi: 10.7554/eLife.41627

Figure 2. Myc activity correlates with differences in single cell transdifferentiation and reprogramming trajectories.

(a) Distribution of gene expression similarity between single cells and reference bone marrow derived macrophages (Hutchins et al., 2017) (acquisition of macrophage state) during transdifferentiation. (b) Correlation between the Myc component and acquisition of macrophage state from a; start and end time points were omitted to improve clarity (they are presented in Figure 2—figure supplement 1a). (c) Myc component at the various transdifferentiation time points. d-f, Single cell trajectories of the B cell state (d), the GMP state (e) and the granulocyte state (f) related to the acquisition of the macrophage state during transdifferentiation. The cells at the respective time points are coloured according to Myc component levels. (g) Distribution of expression similarity between single cells and reference embryonic stem cells (ESCs) during reprogramming. (h) Correlation between Myc component and acquisition of pluripotency from g. (i) Myc component at the various reprogramming time points. (j-l) Single cell trajectories of the B cell state (j), GMP state (k) and inner cell mass state (l) related to the acquisition of the pluripotent state (ESCs) (see also Figure 3—figure supplement 1).

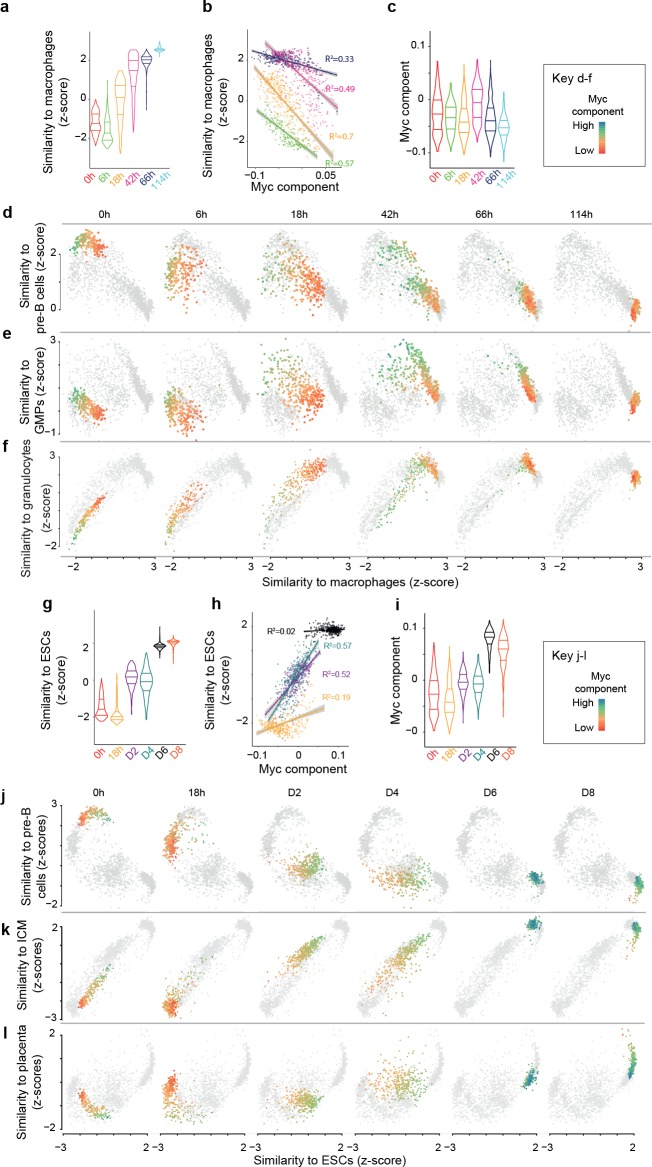
Figure 2.

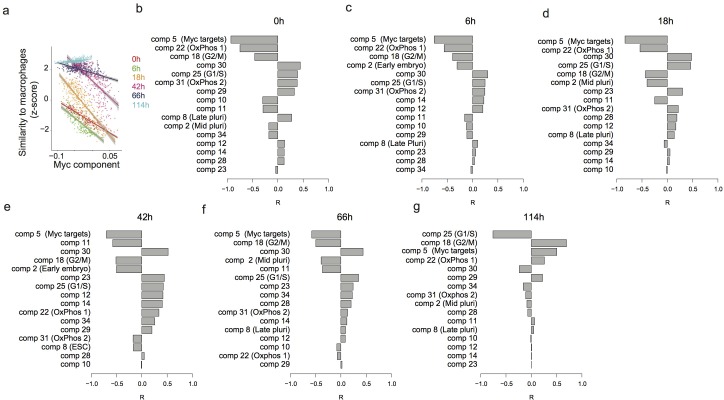
Figure 2—figure supplement 1. Predicting the speed of transdifferentiation.

Figure 2—figure supplement 1.

(a) Expression similarity of single cells with reference bone marrow derived macrophages 0 hr, 6 hr, 18 hr, 42 hr, 66 hr and 114 hr after C/EBPα induction. (b–g) Correlation between each independent component and the expression similarity defined in (a) at 0 hr (b), 6 hr (c), 18 hr (d), 42 hr (e), 66 hr (f) and 114 hr (g) after C/EBPα induction.
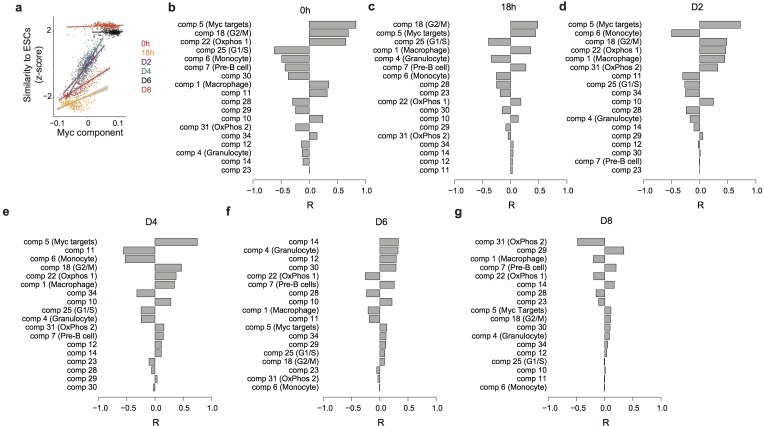
Figure 2—figure supplement 2. Predicting the speed of reprogramming.

Figure 2—figure supplement 2.

(a) Correlation between the Myc component and expression similarity of single cells with ESC at 0 hr and 18 hr after C/EBPa induction and at D2, D4, D6, and D8 after OSKM induction. (b–g) Correlation between each independent component and the expression similarity defined in (a) at 0 hr (b) and 18 hr after C/EBPa induction (c), and at D2 (d), D4 (e), D6 (f) and D8 (g) after OSKM induction.
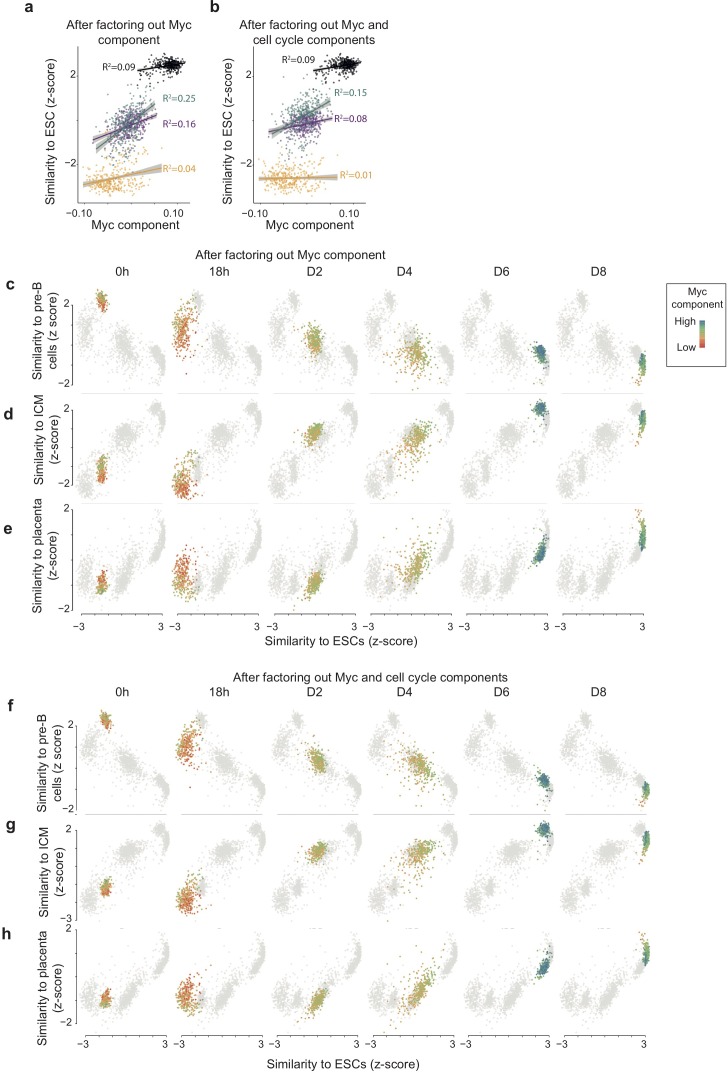
Figure 2—figure supplement 3. High Myc component correlates with faster route towards reprogramming also when factoring out Myc component and cell cycle components before the computation of the similarity score.

Figure 2—figure supplement 3.

(ab) Correlation between Myc component and expression similarity of single cells to reference ESCs (acquisition of pluripotency) at each time point during reprogramming, calculated after factoring out Myc component (a) and both Myc and cell cycle components (b) from both single cell and cell atlas gene expression data (see Materials and Methods). (c–e) Loss of the B cell (c), GMP (d), and monocyte (e) state in relation to acquisition of pluripotency (calculated as in a) at each time point during reprogramming. (f–h) Loss of the B cell (f), (g), and gain of inner-cell-mass-like state (h) and of a placenta-like state in relation to acquisition of pluripotency (calculated as in b) at each time point during reprogramming. Colours indicate the levels of Myc component.