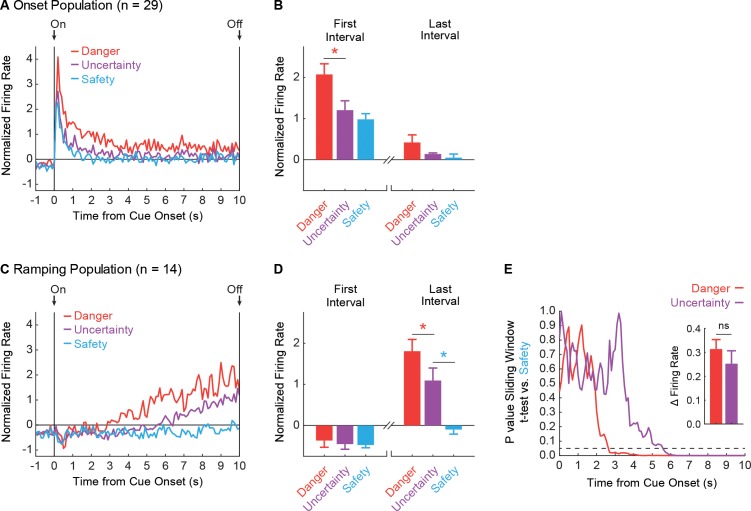
Figure 2. vlPAG neurons are responsive to cue onset or ramp over cue presentation.
(A) Mean, Z-score normalized firing to danger (red), uncertainty (purple) and safety (blue) is shown for the 1 s pre-cue period and the 10 s cue period for the Onset population (n = 29). Cue onset (On) and offset (Off) are indicated by vertical black lines. (B) Mean + SEM, Z-score normalized firing during the first, 1 s cue interval (left) and the last, 1 s cue interval (right), is shown for each cue. Differential firing was observed for danger vs. uncertainty (t28 = 4.54, p=9.70×10⁻⁴, red asterisk) but not for uncertainty vs. safety (t28 = 1.37, p=0.18), in the first interval. No differences were observed for danger vs. uncertainty (t28 = 1.69, p=0.10) or uncertainty vs. safety, (t28 = 0.60, p=0.55) in the last interval. (C) Normalized firing for the Ramping population (n = 14) plotted as in A. (D) First and last interval firing for the Ramping population (n = 14) plotted as in B. Differential firing was not observed for danger vs. uncertainty (t13 = 0.62, p=0.55) or uncertainty vs. safety (t13 = 0.24, p=0.82), in the first interval. By contrast, differential firing was observed for danger vs. uncertainty (t13 = 3.17, p=7.41×10⁻³, red asterisk) and uncertainty vs. safety (t13 = 8.26, p=2.00×10⁻⁶, blue asterisk), in the last interval. (E) A t-test comparing danger (red) and uncertainty (purple) population firing to safety in a 1 s window was slid across the 10 s cue in 100 ms increments. P value of t-test reported on y axis. Dotted line indicates p=0.05. Inset: Mean + SEM change in firing rate from the first window of activity departed from safety to the last interval, is shown for danger (red) and uncertainty (purple). ns = no significance of a paired t-test.


