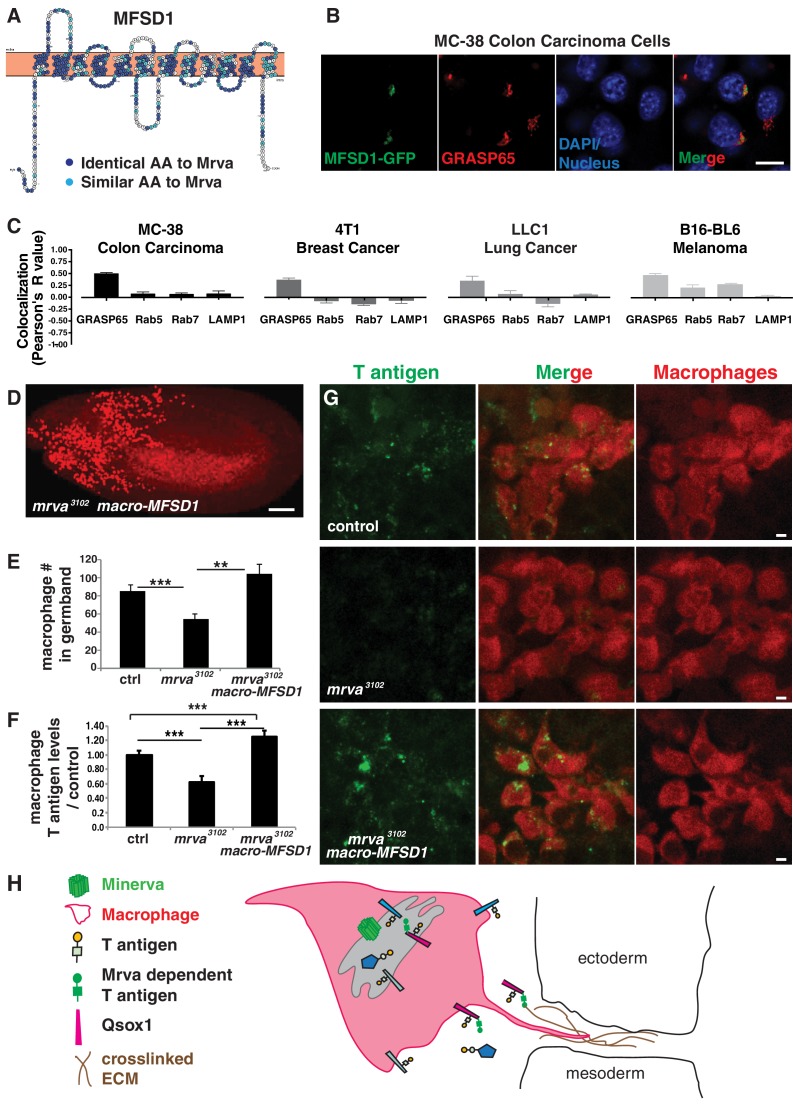
Figure 6. Minerva’s murine ortholog, MFSD1, can substitute for Minerva’s functions in migration and T-antigen glycosylation.
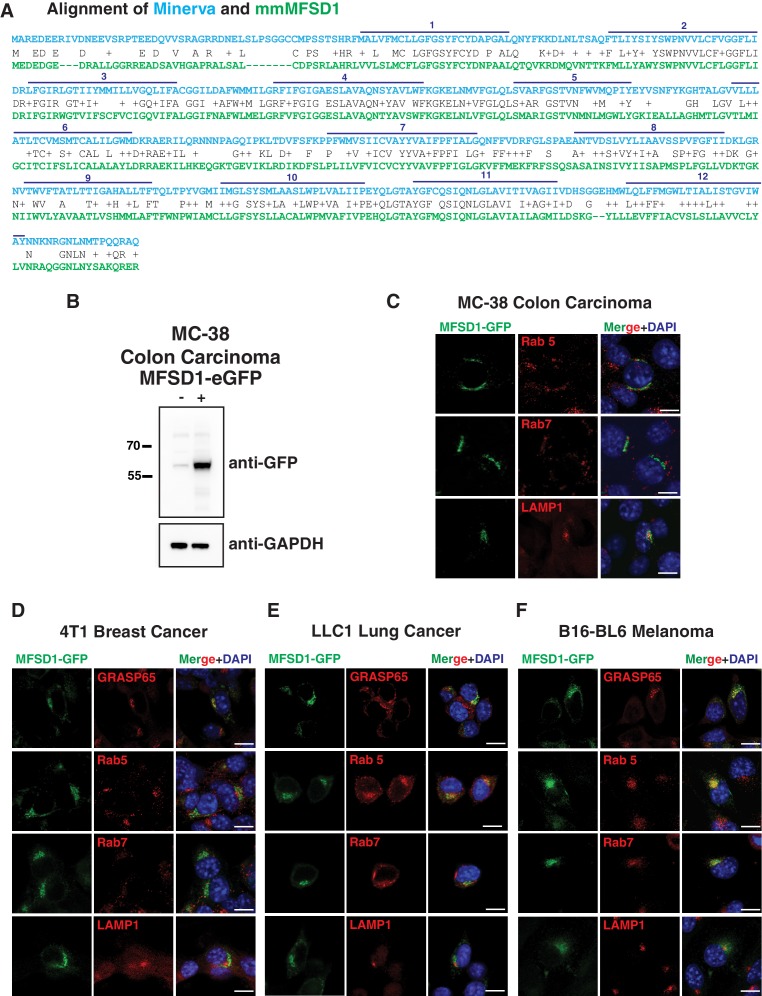
(A) Topology prediction of mouse MFSD1 (NP_080089.1) using the online tools TMPred (Hofman and Stoffel, 1993) and Protter (Omasits et al., 2014). 50% of amino acids are identical between the M. musculus MFSD1 and D. melanogaster sequence of mrva (CG8602) (NP_648103.1) and are highlighted in dark blue, similar amino acids are in light blue. (B) Confocal images of MC-38 colon carcinoma cells showing colocalization of MFSD1-eGFP (green) with the Golgi marker GRASP65 (red). DAPI labels the nucleus (blue). (C) Quantitation using Fiji of the colocalization of MFSD1-eGFP with the Golgi marker (GRASP65), early endosome marker (Rab5), late endosome marker (Rab7), and lysosome marker (LAMP1) in MC-38 colon carcinoma, B16-BL6 melanoma, LLC1 Lewis lung carcinoma, and 4T1 breast carcinoma cells. Representative images are shown in Figure 6—figure supplement 1C–F (n = 8–15, 5–9, 4–9, 5–10 cells per condition within the respective cancer types). (D) Confocal image of a Stage 12 fixed embryo showing that expression of mmMFSD1 in macrophages under the direct control of the srpHemo(macro) promoter in the mrva3102 mutant can rescue the defect in macrophage migration into the germband. Compare to Figure 3A,B. Macrophages visualized with srpHemo-H2A::3xmCherry for D-E. (E) Quantitation of the number of macrophages in the germband of early Stage 12 embryos from the control (n = 25), mrva3102 mutants (n = 29), and mrva3102 srpHemo(macro)-mmMFSD1 (n = 13, p=0.0005 for mutant vs control, p<0.0001 for mutant vs rescue). (F) Quantification of T antigen levels on macrophages in late Stage 11 embryos from control, mrva3102mutant and mrva3102 srpHemo(macro)-mmMFSD1 embryos. T antigen levels normalized to those observed in the control (n = 8–9 embryos, 280, 333, and 289 cells quantified respectively, p<0.0001 for both). (G) Confocal images of macrophages (red) on the germband border stained with T antigen antibody (green) in the control, the mrva3102 mutant, and mrva3102 srpHemo(macro)-mmMFSD1 shows that mmMFSD1 expression in macrophages can rescue the decrease of macrophage T antigen observed in the mrva3102 mutant. Macrophages visualized with srpHemo-3xmCherry for F-G. (H) Model for Minerva’s function during macrophage invasion based on our findings and the literature: Minerva in the Golgi (grey) leads to increases in T antigen levels on a subset of proteins that aid invasion, including Qsox1 which regulates protein folding through disulfide bond formation and isomerization. We propose that increased T antigen on Qsox1 facilitates its sulfhydryl oxidase activity that aids the formation of a robust crosslinked ECM which macrophages utilize during tissue entry. Significance was assessed by Kruskal-Wallis test with Conover post test analysis in E,F). ***p<0.001, ****p<0.0001. Scale bars are 10 μm in B, 50 μm in D, and 3 μm in G. See also Figure 6—figure supplement 1.


