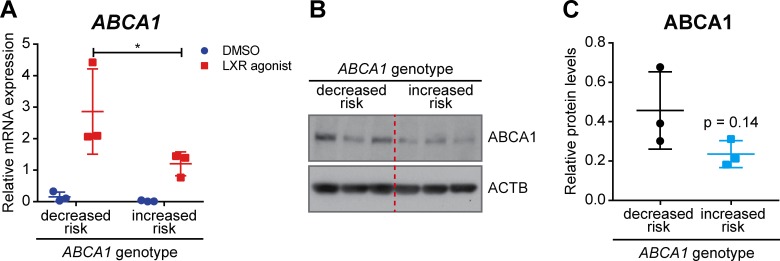
Figure 11. ABCA1 expression in human LCLs.
LCLs derived from healthy individuals carrying the AMD decreased or increased risk ABCA1 genotypes were stimulated with an LXR agonist (1 μM) or DMSO vehicle control for 24 hr. (A) ABCA1 mRNA levels were measured by semi-quantitative real-time PCR. Shown are data from individual samples and means ± SD (N = 3, three technical replicates per cell line). Statistics: two-way ANOVA with Sidak’s multiple comparison test; *: p<0.05. ABCA1 protein levels were measured in LXR-stimulated cells by WB and normalized on ACTB levels. Shown are a representative WB (B) and the means ± SD of the band intensity quantification (N = 3, five technical replicates per cell line) (C). Statistics: Student’s t-test vs ‘decreased risk’.

