. 2019 Mar 13;8:e45100. doi: 10.7554/eLife.45100

Figure 3. Effect of lipid accumulation in the ageing mouse RPE.

(A) RPE flat mounts from 4-months-old Ctr and RPEΔAbca1;Abcg1 mice were stained for ZO-1 (red) and β-cat (green). White arrowheads indicate loss of co-localization between ZO-1 and β-cat in mutant RPE. Nuclei were counterstained with Hoechst. Shown are representative images of N = 3 animals per group. Quantification of cell area (B) and cell shape (C) was performed using ImageJ on images from ZO-1 stained flat mounts. Corresponding measurements of single analyzed cell can be found in Figure 3—source data 1. Statistics: Mann-Whitney test; **: p<0.01, ****: p<0.0001. Light microscopy was used to visualize outer retinas of control and RPEΔAbca1;Abcg1 mice: shown are panoramas (D) and RPE at higher magnification (E). Representative images of N ≥ 3 animals per group. Cre (F) and Mct3 (G) mRNA levels were measured by semi-quantitative real-time PCR in eyecups from Ctr and RPEΔAbca1;Abcg1 mice at the indicated ages. Shown are data from individual samples and means ± SD (N = 3–4). Statistics: one-way ANOVA vs ‘2 months’ of the respective genotype; *: p<0.05, ***: p<0.001. n.d.: not detected. Abbreviations as in Figure 1.

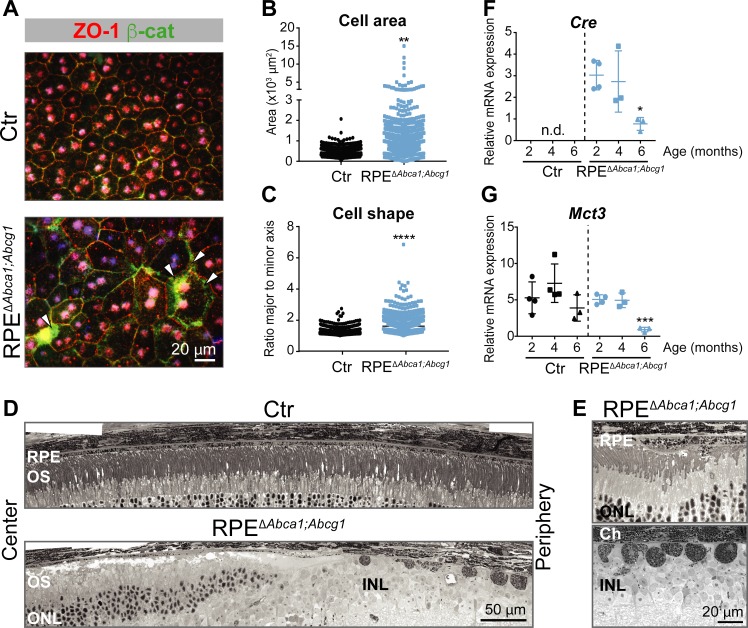
Figure 3—source data 1. RPE cell Area and shape of RPE cells in RPEAbca1;Abcg1 and control mice.
elife-45100-fig3-data1.xlsx (126.2KB, xlsx)
DOI: 10.7554/eLife.45100.010

Figure 3.

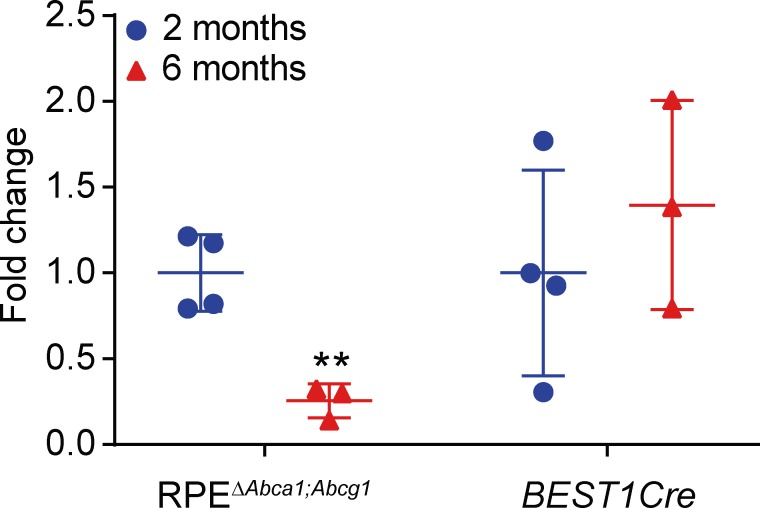
Figure 3—figure supplement 1. Cre expression in RPEΔAbca1;Abcg1 and BEST1Cre mice.

Figure 3—figure supplement 1.

Cre mRNA levels were measured by semi-quantitative real-time PCR in eyecups of 2- and 6-months-old RPEΔAbca1;Abcg1 and BEST1Cre mice. Shown are data from individual samples and means ± SD of the fold change on the corresponding "2 months" average (N = 3–4). Statistics: Student’s t-test vs ‘2 months’ of the respective genotype; **: p<0.01.
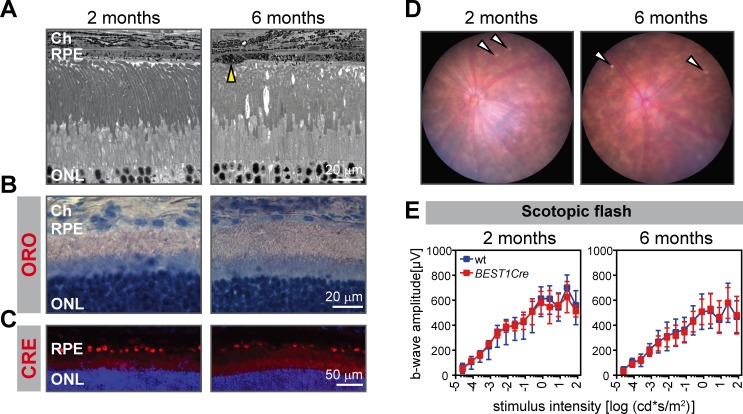
Figure 3—figure supplement 2. Absence of retinal phenotype in BEST1Cre mice up to 6 months of age.

Figure 3—figure supplement 2.

(A) Retinal morphology was analyzed by light microscopy in 2- and 6-months-old BEST1Cre animals. Yellow arrowhead indicates an example of occasionally observed minor alterations in the RPE. Retinal sections of BEST1Cre mice at indicated ages were stained for lipids (B) and CRE (C). Nuclei were counterstained with hematoxylin (B) or DAPI (C). (D) Occasional bright spots were observed in the fundus of BEST1Cre mice (indicated by white arrowheads). Representative images of N ≥ 3 animals per group. (E) ERG recordings of BEST1Cre and age-matched wild type animals. Shown are means ± SD (N = 3–9) of scotopic b-wave amplitudes. Abbreviations as in Figure 1.