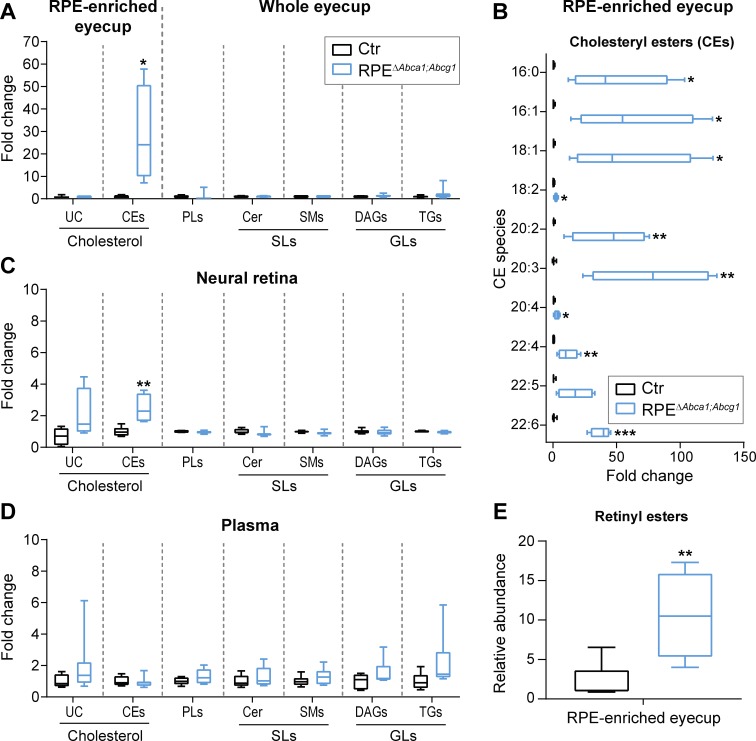
Figure 5. Cholesteryl esters as main components of LDs in the RPE of RPEΔAbca1;Abcg1 mice.
Lipid composition of eyecups (A), neural retinas (C) and plasma (D) from 2-months-old Ctr and mutant mice was measured by mass spectrometry-based methods. The following lipid classes were analyzed: cholesterol (un-esterified cholesterol, UC, and cholesteryl esters, CEs), phospholipids (PLs: sum of phosphatidylcholine, phosphatidylethanolamine, phosphatidylserine, phosphatidylinositol and phosphatidylglycerol), sphingolipids (SLs: ceramides, Cer, and sphingomyelins, SMs) and glycerolipids (GLs: diacylglycerols, DAGs, and triglycerides, TGs). (B) Cholesteryl esters species containing the indicated fatty acids were quantified in eyecups from the same animals. (E) Relative quantification of retinyl esters was performed in eyecups from 2-months-old Ctr and RPEΔAbca1;Abcg1 mice. Shown are box plots of folds on respective Ctr average, whiskers correspond to min and max values (N = 4–10). Lipid concentration values corresponding to fold changes in (A), (C) and (D) as well as single PL classes can be found in Supplementary file 1A. Please note that UC, CEs and REs were determined in RPE-enriched eyecups whereas PLs, SLs and GLs were determined in whole eyecups. Also, tissues from both eyes of the same animals were used for analysis of UC, CEs and REs, whereas tissues from single eyes were used for PLs, SLs and GLs (see ‘Materials and methods’). Statistics: Student’s t-test vs ‘Ctr’; *: p<0.05, **: p<0.01, ***: p<0.001.

