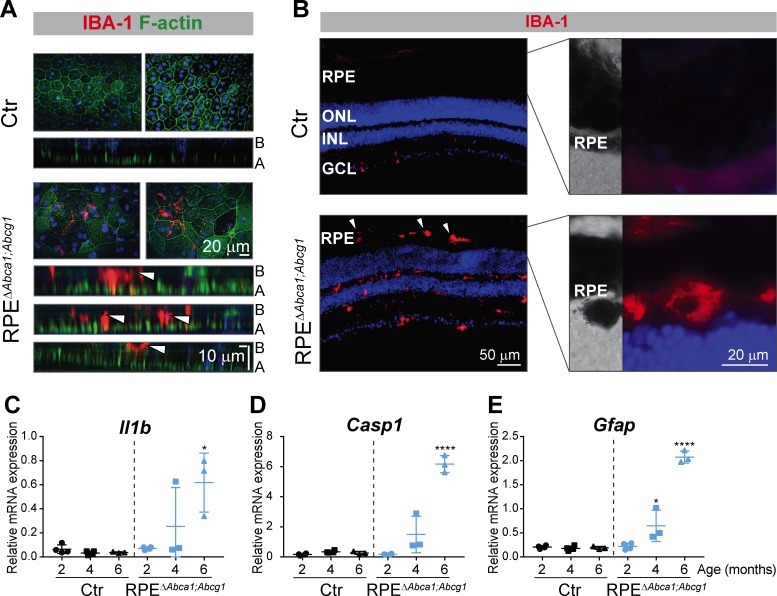
Figure 9. Inflammatory response in RPEΔAbca1;Abcg1 mice.
(A) RPE flat mounts from 4-months-old Ctr and RPEΔAbca1;Abcg1 mice were stained with phalloidin (green, staining actin filaments) and anti-IBA-1 (red). Shown are representative top-view images and cross-sections (A = apical side, B = basal side). White arrowheads indicate IBA-1-positive cells located inside or at the choroidal (basal) side of the mutant RPE. Nuclei were counterstained with Hoechst. (B) Retinal sections from 6-months-old mice were stained for IBA-1 (red): increased signal intensity and presence of sub-retinal macrophages/microglia was detected in RPEΔAbca1;Abcg1 mice (higher magnification images of the outer retina are shown in right panels). Nuclei were counterstained with DAPI. Representative images of N = 3 animals per group. Il1b (C), Casp1 (D) and Gfap (E) mRNA levels were measured by semi-quantitative real-time PCR in neural retinas from Ctr and RPEΔAbca1;Abcg1 mice. Shown are data from individual samples and means ± SD (N = 3–4). Statistics: one-way ANOVA vs ‘2 months’ of the respective genotype; *: p<0.05, ****: p<0.0001. Abbreviations as in Figure 1.

