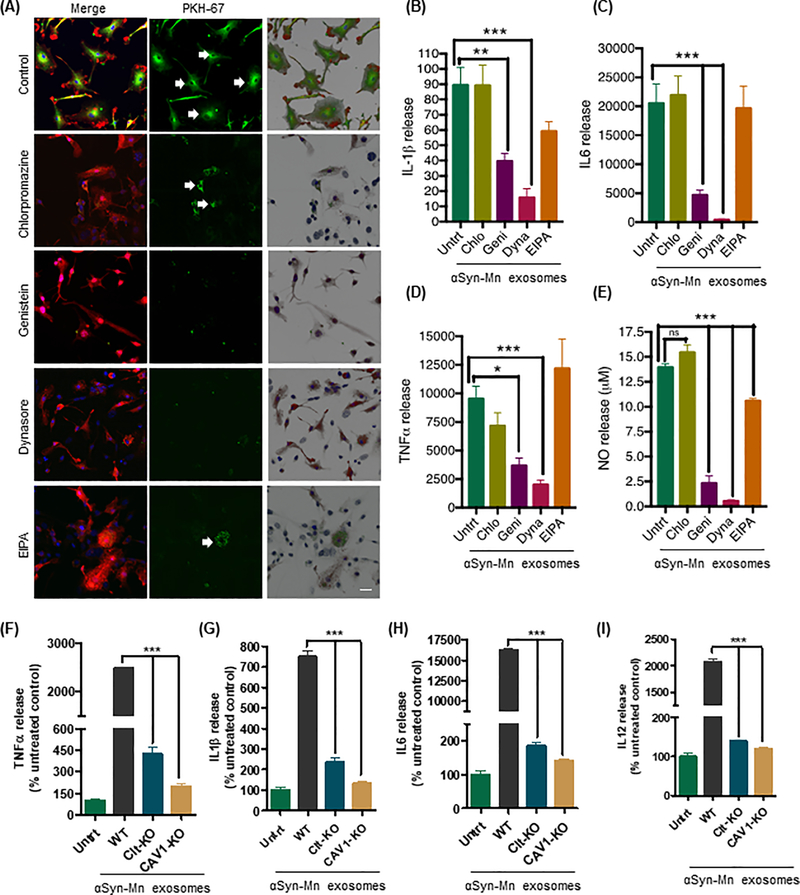
Figure 3: Microglia internalize Mn-stimulated αSyn exosomes through caveolin-1-mediated endocytosis.
(A) Immunofluorescence analysis of the chemical inhibition of Mn-stimulated αSyn exosome uptake. The left column represents merged images of IBA-1 immuno-positive microglia (red) and PKH67-labeled exosomes (green), middle column represents effective uptake/inhibition of PKH67-labeled exosomes (green), and the right column represents the 3D surface reconstruction generated by Imaris software. Magnification, 60X. Scale bar, 10 μm. (B to D) Inhibition of pro-inflammatory cytokine release quantified using Luminex bead-based cytokine assays. Data are mean ± SEM (*p≤0.05, **p<0.01, ***p<0.001 by one-way ANOVA with Tukey’s post-test) of four individual experiments each performed with 8 technical replicates. (E) Effective inhibition of nitric oxide release from genistein and Dynasore (each 50 μM)-treated WTMC cells observed through Griess assay. Data are mean ± SEM (***p<0.001, ns = not significant) of four individual experiments performed in 8 replicates. (F to I) Assessment of pro-inflammatory cytokine release upon treatment of caveolin-1– or clathrin–knockdown (Cav1-KD and CLTC-KD, respectively) primary murine microglial cells with Mn-stimulated αSyn exosomes, quantified using Luminex bead-based cytokine assay. Data are mean ± SEM (**p<0.01, ***p<0.001 by one-way ANOVA with Tukey’s post-test) of four individual experiments performed in 8 replicates.

