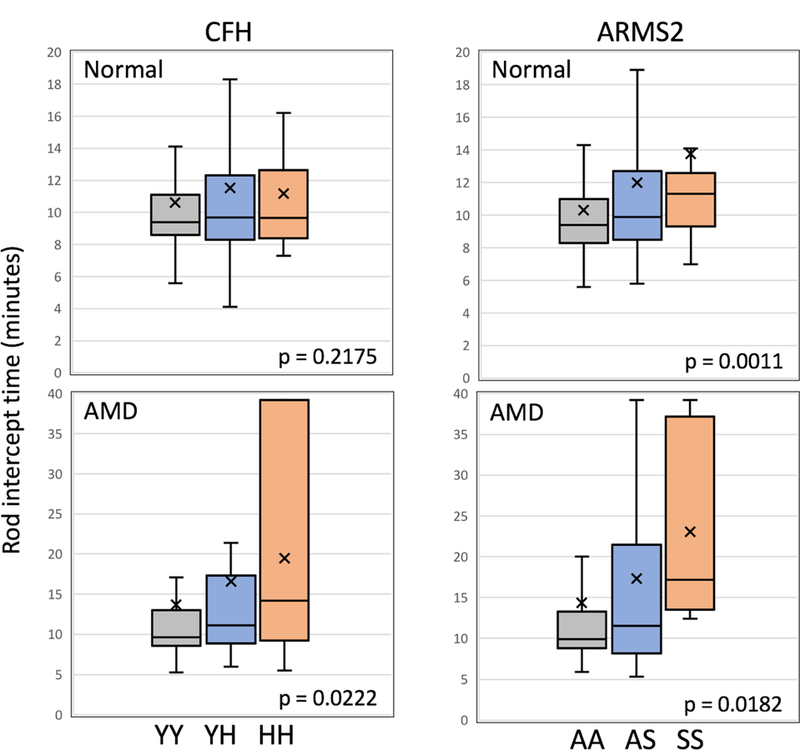
Figure 2.

Box plots shown separately for normal macular health cases (upper panels) and those with AMD (lower panels) showing the distribution of RIT for CFH (left) and ARMS2 (right) genotypes. Associations are adjusted for age and smoking status. The box representation is as described in Figure 1. Note that ARMS2 A69S is associated with increased RIT in subjects in normal macular.
