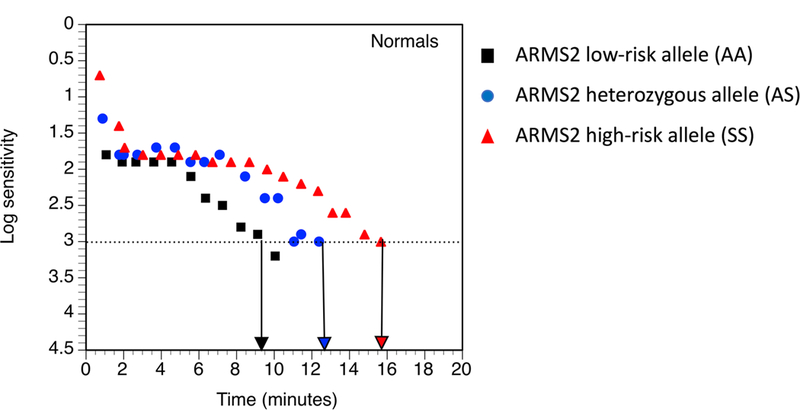
Figure 3.

Representative rod-mediated dark adaptation plots (log sensitivity over time) from individual normal eyes with the low-risk (black squares), heterozygous (blue circles), and the high-risk, homozygous ARMS2 genotype (red triangles). Arrows pointing to the x-axis indicate the RIT for each eye. Note that the individual homozygous for the high-risk allele is slower to recovery sensitivity than the individual with the heterozygous genotype; and the latter is slower to recover than the individual homozygous for the low-risk allele.
