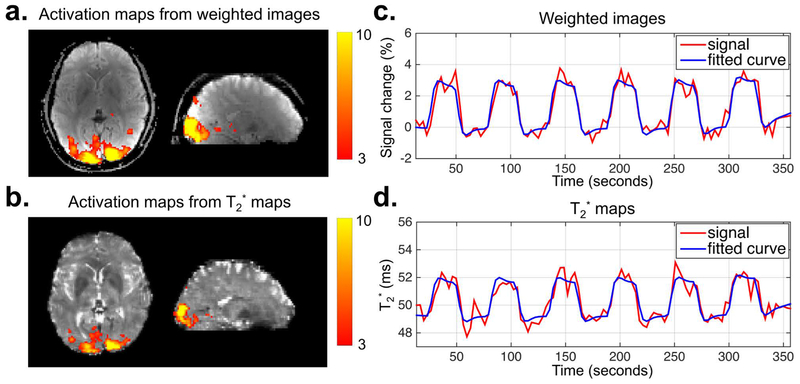
FIG. 10.
The results of the fMRI experiment acquired by GE SMS-EPTI with visual stimuli from a single subject. The z-score activation maps (a and b), the percentage signal change curve of the weighted images (c) and the T2* value curve (d) (from the maximum z statistic voxel) are shown. A temporal resolution of 3.3 s per volume was provided by 3-shot GE SMS-EPTI with a whole-brain coverage at a 2×2×3 mm3 resolution. The multi-contrast images acquired at 34 TEs for each TR were used to generate a time series of weighted images and T2* maps for activation analysis as shown in the top and bottom row respectively. Both results show strong activation in the occipital cortex, and strong correspondence between the signal changes (red) and the task contrast (blue).

