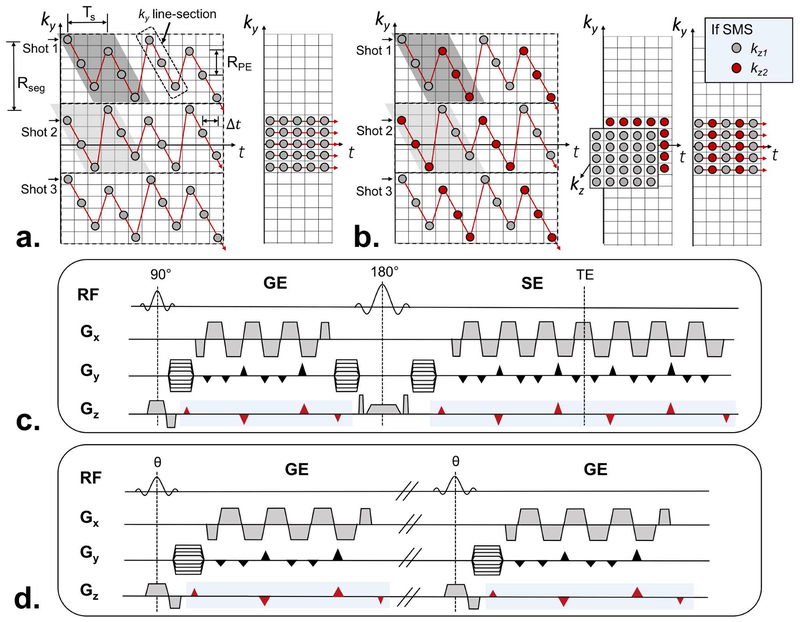
FIG. 2.
Detailed description of EPTI sampling pattern and sequence diagram. (a) Multiple shots are used to cover the ky-t space, each with a spatial and temporal CAIPI trajectory that contains multiple diagonal ky line-sections. Each of these ky line-sections includes a number of temporally adjacent readout lines (dot) spacing apart in time by an EPI echo spacing Δt and in PE direction by RPE. The two adjacent ky line-sections are interleaved in the PE direction (highlighted in gray), and separated in time by a spacing of Ts, equal to the product of the echo spacing (Δt) and the number of data samples in each ky line-section (Ns). The segment size along PE direction of each shot (Rseg) can be determined by the product of RPE and Ns. A low-resolution calibration scan can be acquired by 20–30 EPI readouts without any phase encoding blips as shown on the right. (b) The red and gray color illustrate the sampling pattern when SMS is applied into EPTI acquisition at MB=2. The fully-sampled low resolution calibration data (kx-ky-kz-t) can be acquired as shown in the middle. This fully-sampled acquisition can be further accelerated using blipped-CAIPI SMS as shown on the right, in which case additional short SMS calibration data is acquired and used to reconstruct the EPTI calibration data first. The sequence diagrams of (c) GESE-EPTI, and (d) GE-EPTI are also shown, where EPTI readout can be continuously played out in the sequence to achieve high efficiency. The marked blue region indicates the Gz gradients that should be applied when SMS is employed.

