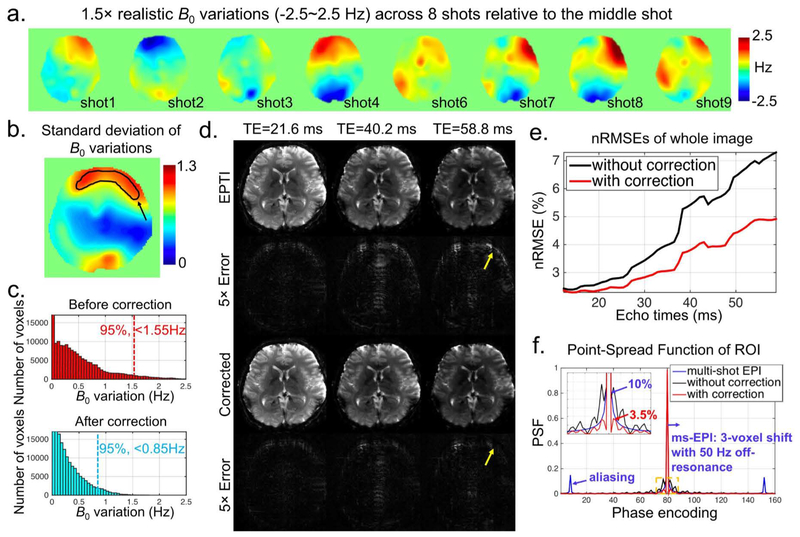
FIG. 5.
The effects of shot-to-shot B0-variations on EPTI. (a) 1.5× realistic B0-variations with a range of ±2.5 Hz were used to simulate a 9-shot EPTI dataset with phase variations. Eight maps are shown here relative to the middle shot. (b) Spatial distribution of standard deviation of B0-variations across 9 time points, with a marked ROI showing the region with the most-varied B0. (c) The histograms of the original simulated B0-variations and the residual effective B0-variations after correcting B0-variation induced phase. The maximum B0-variation component was reduced from 2.5 Hz to 1.5 Hz, and the upper bound of the B0-variation components in 95% of the voxels from 1.55 Hz to 0.85 Hz. (d) The reconstructed images and their corresponding 5× error maps at three selected TEs, with yellow arrows indicating the regions with the most varied B0 field as shown in (b). (e) The nRMSEs of the whole image as a function of echo times with and without correction. (f) PSFs of the conventional interleaved multi-shot EPI, and EPTI with and without correction. Note that only the middle part of the PE direction is shown here (the actual size is 224).

