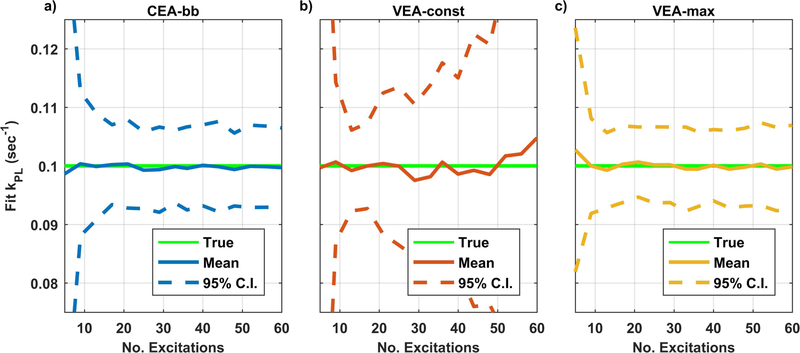
Figure 3. Summary of mean and 95% confidence interval of kpl values derived from repeated analysis of noisy synthetic data.
The solid green line shows the value used in the generation of simulation data. The solid blue, red, and yellow lines represent the mean fit values for with the constant excitation angle broadband (CEA-bb), constant signal variable excitation angle (VEA-const), and maximal lactate variable excitation angle (VEA-max) design strategies, respectively. The dashed lines represent the 95% CI of the fit results determined from the standard deviation of 100 repeated fits with fresh Gaussian noise. There is no statistical difference between VEA-max and CEA-bb strategies but both have statistically improved repeatability compared to VEA-const strategy.

