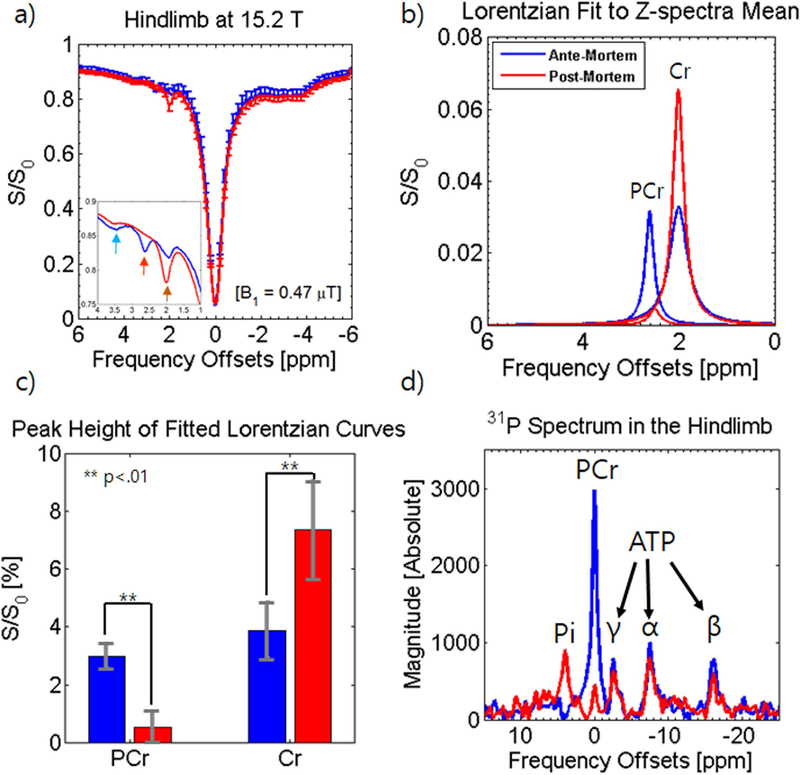
Figure 5. In vivo Z-spectra analysis of the hindlimb at 15.2 T and 31P-MRS at 9.4 T before and after euthanasia.
Z-spectra with error bars are shown before (blue) and after euthanasia (red) at 0.47 μT with a 4 s duration at 15.2T (a) and expanded Z-spectra at a range of 1.0 to 4.0 ppm are shown inset. Error bars are only shown on one side of the curve for better visualization. PCr and Cr peaks obtained from multi-pool Lorentzian fitting are shown before and after euthanasia (b) and a statistical analysis of peak height show significant differences (c). 31P-MRS spectra at 9.4T are shown overlaid before and after euthanasia (d).

