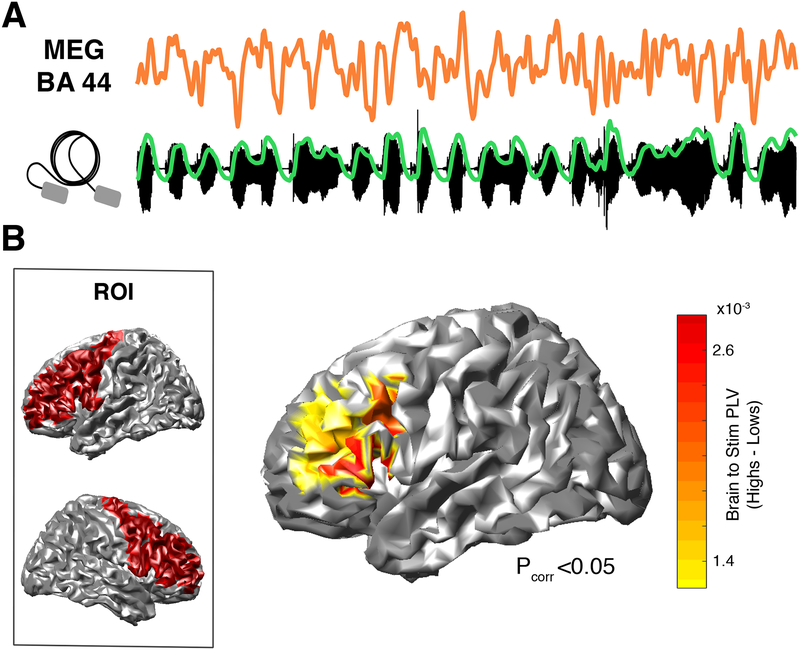
Fig. 2. Neural distinction between groups: neurophysiological data.
(A) Activity from a high synchronizer generated in BA44 (upper panel) during passive listening to the stimulus (lower panel; in green, stimulus envelope). Similar signals were obtained for the others (N=17) high synchronizers. (B) Brain-to-stimulus synchronization. Left panel: ROI comprising bilateral pre-central, middle frontal and inferior frontal gyri. Right panel: Brain surface map showing PLV differences between groups (Nhigh = 18, Nlow = 19; Mann-Whitney-Wilcoxon test, two-sided p < 0.05, FDR-corrected).

