
Figure 4.
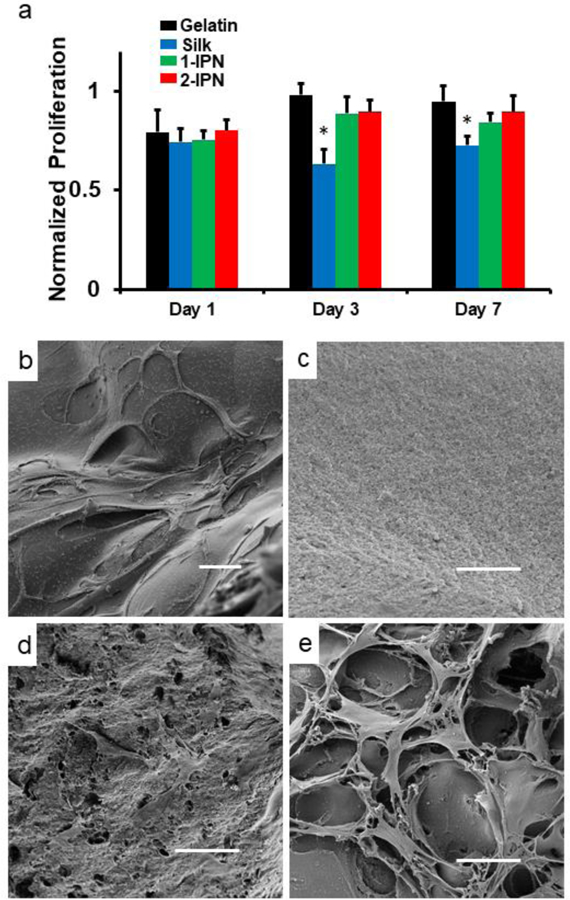
(a) Proliferation of hDFs on hydrogels. The results were normalized to the cells on tissue culture polystyrene (TCPS). * denote p < 0.05 compared to the gelatin group (n = 4). (b-e) SEM images on day 3. (b) Gelatin hydrogel (c) Silk hydrogel (d) 1-IPN (e) 2-IPN. Scale bar = 50 µm. Larger versions of SEM images can be found in ESI.