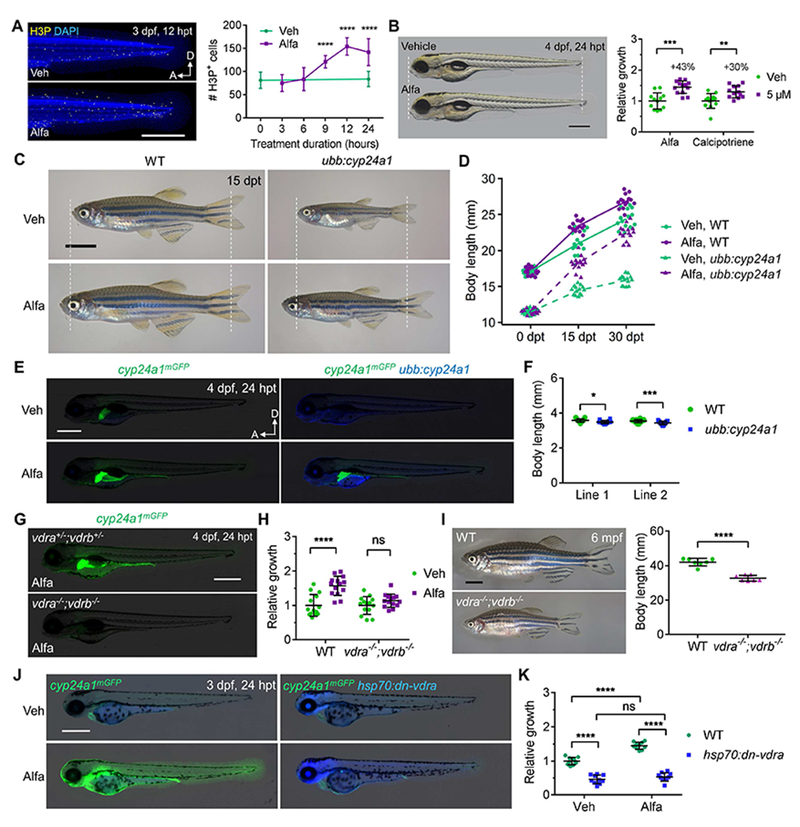
Figure 2. Vitamin D Signaling Enhances Organismal Size.

(A) MIP images and quantification of H3P staining of 3 dpf embryos. n = 11-13. Scale bar, 500 μm.
(B) Example and quantification of 4 dpf zebrafish growth. Scale bar, 500 μm. n = 12-14.
(C) Growth and rescue of 2 mpf juvenile WT and ubb:cyp24a1 zebrafish. Scale bar, 4 mm.
(D) Quantification of zebrafish length before and after treatment. n = 14-15.
(E) mGFP and TagBFP expression in 4 dpf embryos treated with vehicle or 10 nM Alfa. Scale bar, 500 μm.
(F) Quantified body length of two independent ubb:cyp24a1 lines and WT siblings at 4 dpf. n=14-23.
(G) cyp24a1mGFP expression in 1 μM Alfa-treated embryos.
(H) Quantification of relative growth of 4 dpf embryos treated with vehicle or Alfa for 24 hours. n = 13.
(I) Representative images and body length quantification of 6 mpf zebrafish. Scale bar, 5 mm. n = 7.
(J) mGFP and TagBFP expression of 3 dpf embryos after a single heat-shock and 24-h drug treatment. Scale bar, 500 μm.
(K) Quantified relative growth of 4 dpf embryos after a heat shock and 24-h drug treatment. n = 10.
See also Figure S2.
