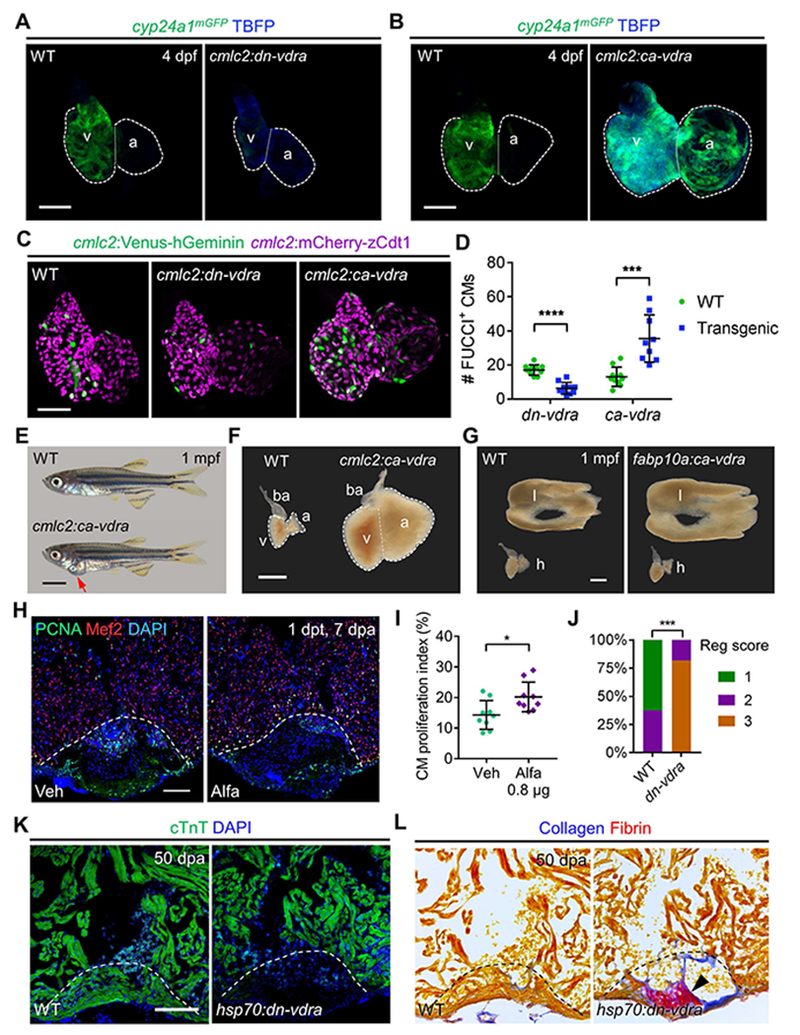
Figure 3. Tissue-Intrinsic Effects of Vitamin D Signaling and Impact on Heart Regeneration.

(A) MIP images of cyp24a1mGFP expression in dissected hearts. Scale bar, 50 μm.
(B) MIP images of cyp24a1mGFP expression in dissected hearts. Scale bar, 50 μm.
(C) MIP images of dissected cmlc2:FUCCI hearts in indicated transgenic backgrounds. Scale bar, 50 μm.
(D) Quantification of FUCCI+ CMs in (C). n=9-10.
(E) Examples of 1 mpf cmlc2:ca-vdra and WT zebrafish. Red arrow indicates gross pericardial enlargement caused by cardiomegaly in cmlc2:ca-vdra zebrafish. Scale bar, 2 mm.
(F) Darkfield images of dissected 1 mpf hearts. a, atrium; ba, bulbus arteriosus; v, ventricle. Scale bar, 500 μm.
(G) Darkfield images of dissected livers (l) and hearts (h) from 1 mpf zebrafish. Scale bar, 500 μm.
(H) Examples of Mef2/PCNA staining of 7 dpa hearts after a single injection. Dashed lines represent amputation planes. Scale bar, 100 μm.
(I) Quantification of CM proliferation indices in (H). n = 9.
(J) Quantified heart regeneration scores of WT or hsp70:dn-vdra(dn-vdra) zebrafish given daily heat-shocks from 6 to 50 dpa. Regeneration scores (Reg scores) indicate vigorous regeneration (1), partial regeneration (2) or blocked regeneration (3), as shown in Figure S3N. n = 8-11. ***p < 0.001 (Two-tailed Fisher’s exact test).
(K) Representative images of cTnT staining at 50 dpa, after daily heat-shock from 6 dpa. Scale bar, 100 μm.
(L) Representative images of AFOG stains to indicate Fibrin (red) and Collagen (blue) within the same hearts in (K). Arrowhead indicates scar tissue.
See also Figure S3.
