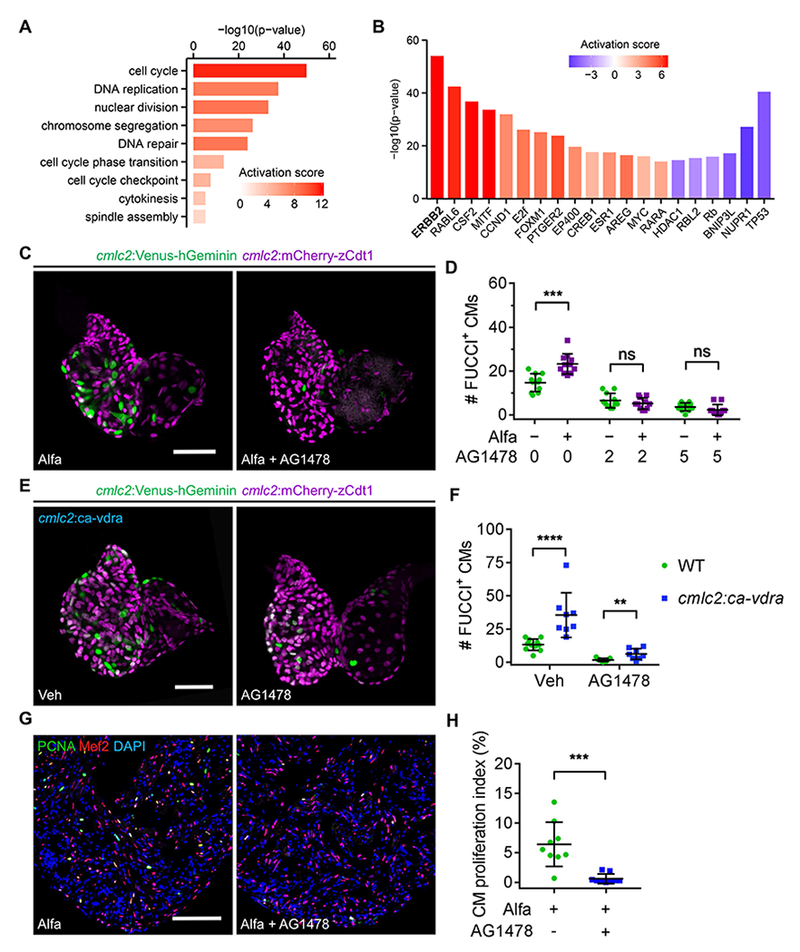
Figure 4. ErbB2 Blockade Inhibits Vitamin D-Induced Cardiomyocyte Proliferation.

(A) Selected functional cluster enrichment of differentially expressed genes. The activation score infers the activation score of the corresponding process.
(B) Selected common upstream regulators of differentially expressed genes in adult hearts after three Alfa injections. The p-value measures the statistical significance of the overlap between differentially expressed genes and the genes under predicted control of a regulator, and the Activation score infers the activation state and score of a regulator, either activating (positive) or inhibiting (negative).
(C) MIP images of dissected 4 dpf cmlc2:FUCCI hearts after 24-h treatment. Scale bar, 50 μm.
(D) Quantification of FUCCI+ CMs of 4 dpf cmlc2:FUCCI embryos after 24-h treatment. n = 11.
(E) MIP images of dissected 4 dpf hearts after 24-h treatment. Scale bar, 50 μm.
(F) Quantification of FUCCI+ CMs of 4 dpf embryos after 24-h treatment. n= 8-11. (G) PCNA/Mef2 staining of ventricles from Alfa-injected zebrafish treated with vehicle or AG1478 for 24 h starting at 2 h after the last Alfa injection. Scale bar, 100 μm.
(H) Quantification of CM proliferation indices of experiments in (H). n = 9. ***p < 0.001. See also Figures S4, Table S2 and S3.
