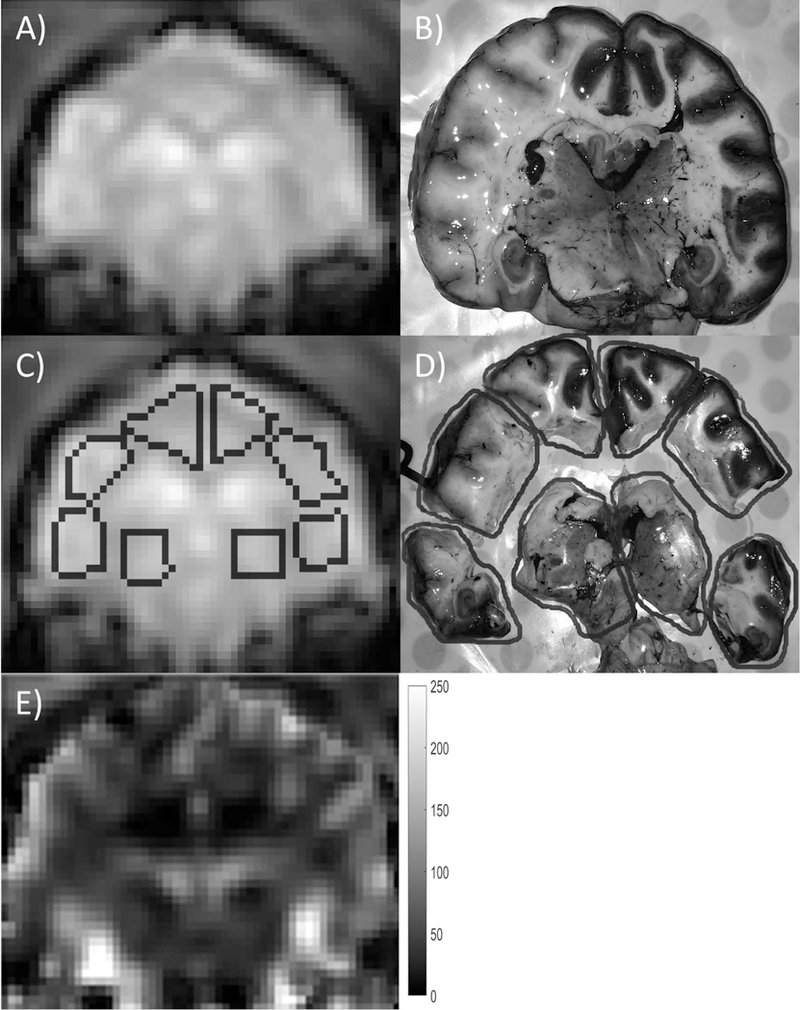
Figure 2.

Example of ROI registration between MRI and actual excised brain sections. Each slice was separated into eight regions, and corresponding ROIs were drawn on the MRI DSC images. The MRI DSC image (A, C) and photographic image (B, D) are shown with and without ROI contours (dark gray). The brain slice in (B) was cut into eight regions as shown in (D) for microsphere analysis. A qCBF (ml/100g/min) map of the same slice is shown in (E) for reference. In order to minimize bias, the ROIs were drawn on the DSC image prior to any knowledge of the qCBF map.
