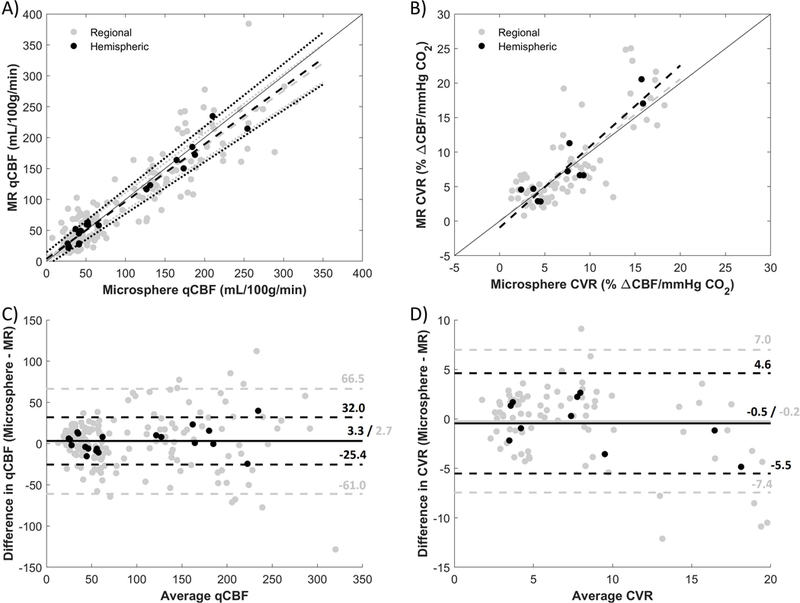
Figure 3.

Correlation and Bland-Altman plots of MR against microspheres for qCBF and CVR. In the correlation plots of A) qCBF and B) CVR, regional averages are shown in gray and hemispheric averages are in black. Dashed lines are derived from linear regression analysis, dotted lines represent 95% CI, and a line of unity is shown for reference. In the Bland-Altman plots of C) qCBF and D) CVR, the bias is represented by a solid line and the dashed lines are the limits of agreement. Though bias is low in both cases, there is quite a bit of spread in the differences.
