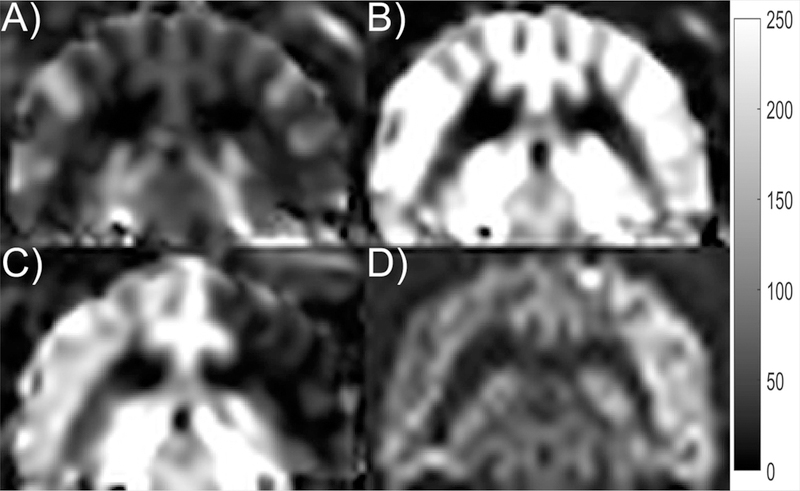
Figure 6.

Representative slice for (A) qCBF at normocapnia, (B) qCBF at hypercapnia, (C) qCBF with MCAO, and (D) DWI taken 2 hours after occlusion. The qCBF images are shown with a dynamic range of 0 to 250 ml/100g/min. The affected area in the (C) qCBF image with MCAO is shown as hypointense and is confirmed by the hyperintense area in the DWI. The unaffected hemisphere (left side of the image in C) is shown with high CBF despite normocapnia. This may have been due to increased usage of isoflurane during the longer experiment of day 2. The same effect was observed in the microspheres.
