Figure 7.

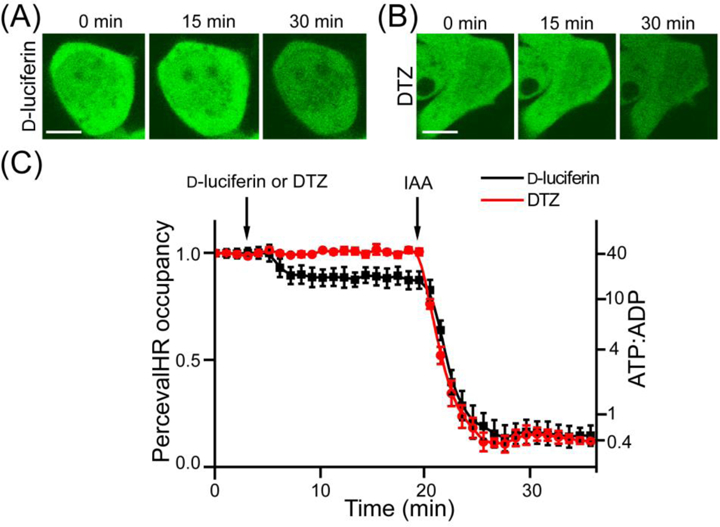
(AB) Representative fluorescence images of HEK293T cells expressing PercevalHR and either FLuc (A) or teLuc (B), upon addition of D-luciferin (A) or DTZ (B). Iodoacetic acid (IAA) was used to treat cells after D-luciferin to completely deplete ATP. Scale bars: 10 μm. (C) PercevalHR occupancy and estimated ATP:ADP ratio changes upon treatment with D-luciferin or DTZ. Images were captured with 488 nm excitation, and the emission was collected from 510 to 600 nm.
