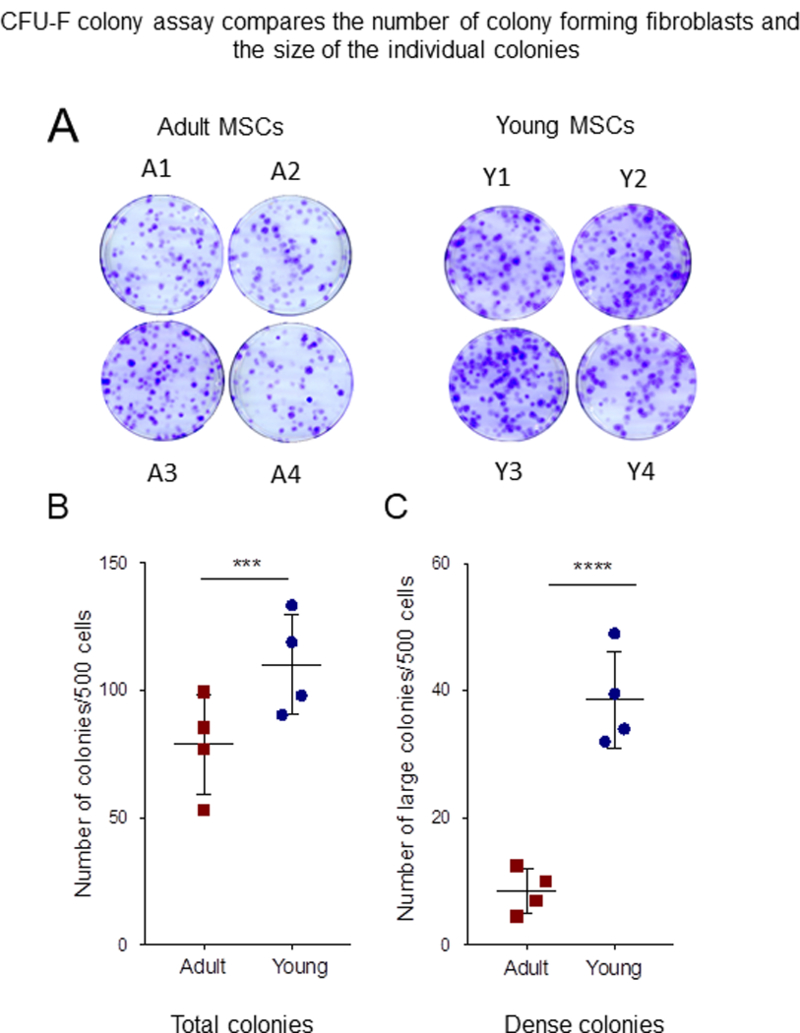
Figure 2: CFU-F assay.

(A) 500 cells of adult and young BMSCs were seeded per 100-mm plate. After 10 days, the plates were stained with crystal violet. Pictures are crystal violet stained plate of CFU-F assay performed on four donors, adult BMSCs (A1-A4) and young (Y1-Y4). (B) Quantification of total colony number. There is significant donor variation in between the samples (C) Colony morphology was assessed by size and density. Large diameter (> 2.5 mm) and dense cell growth (> 80% confluency), the graph shown is quantification of large and dense (LD) colony number. The young cells perform significantly better than the adult cells. Error bars represent mean±SEM; n=4; *p < 0.05; **p < 0.01.
