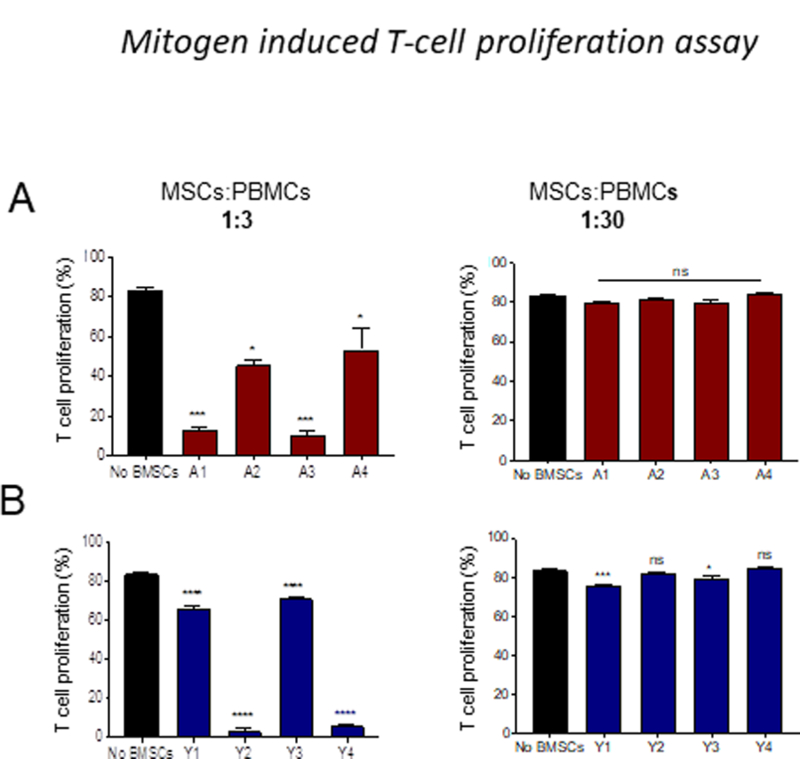
Figure 3: Young BMSCs are more potent in inhibiting mitogen induced T cell proliferation.

CD3 T cell proliferation was evaluated using CFSE dilution method. CFSE-labelled PBMC were stimulated with Con A (5 ug/ml) in the presence or absence of BMSCs. BMSCs to PBMCs ratio used are 1:3, 1:10 and 1:30. The data presented is the percentage of CFSE+CD3+ cells. (A) Adult BMSCs (B) Young BMSCs. Error bars represent mean±SEM; n=4; *p < 0.05; **p < 0.01; ***p < 0.001; ****p < 0.0001; ns-not significant.
