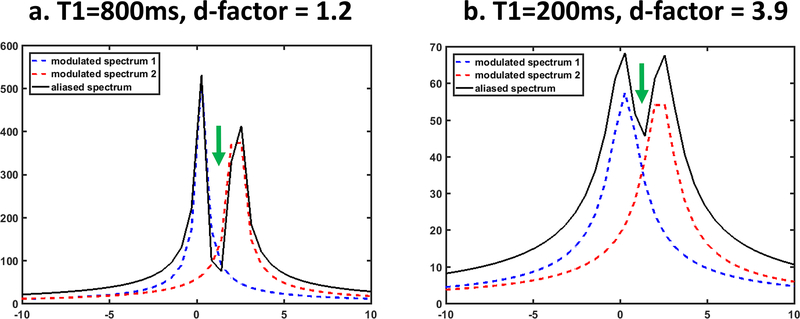
Figure 4.
Illustration of the impact of signal dynamics on d-factor, using 2-fold SUPER T1-mapping acceleration. The d-factor is 1.2 when both aliasing signals have T1 of 800ms, and rises to 3.9 when T1 is 200ms. When T1 is reduced, the signal grows faster, resulting in a wider spectrum, which in turn causes more overlapping (arrows) and elevates the d-factor.

