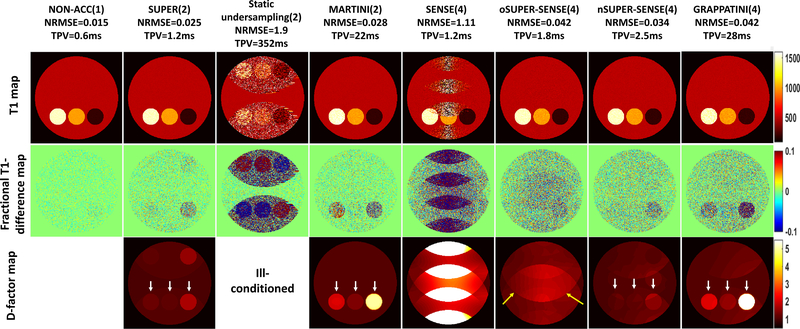
Figure 5.
Simulation comparing standard non-acceleration T1 mappng (R=1), SUPER (R=2), static undersampling based T1 mapping (R=2), MARTINI (R=2), SENSE-based T1 mapping (R=4), oSUPER-SENSE (R=4), nSUPER-SENSE (R=4), and GRAPPATINI (R=4). The top, middle, and bottom row shows the reconstructed T1 maps, the fractional T1-difference maps, and the d-factor maps for each method. The d-factor map for the static undersampling based T1 mapping cannot be calculated due to the severe ill-conditioning, NRMSE and TPV were noted under each method’s name. Yellow arrows point to the elevation of d-factor due to 4-fold aliasing in oSUPER-SENSE. White arrows point to the little bottles, with T1 of 200ms (right), 1000ms (middle), and 1500ms (left), which have a higher d-factor with MARTINI/GRAPPATINI than SUPER/SUPER-SENSE.

