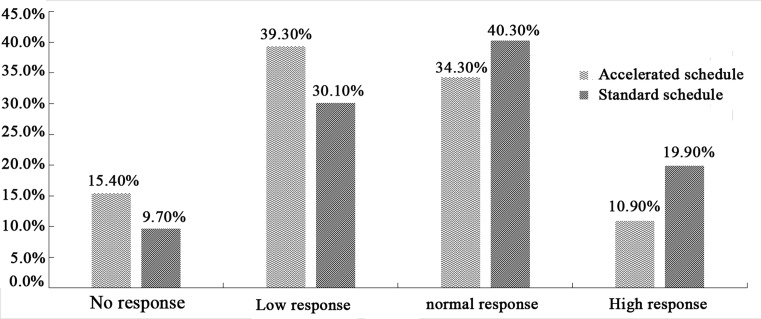
Figure 1. Anti-HBs seroconversion rates on the two vaccination schedules.
The left vertical axis represents the rate of anti-HBs seroconversion. Wave represents the anti-HBs seroconversion rates on accelerated schedule in each group, and slash represents the anti-HBs seroconversion rates on standard schedule in each group. The horizontal axis represents the reaction type.

